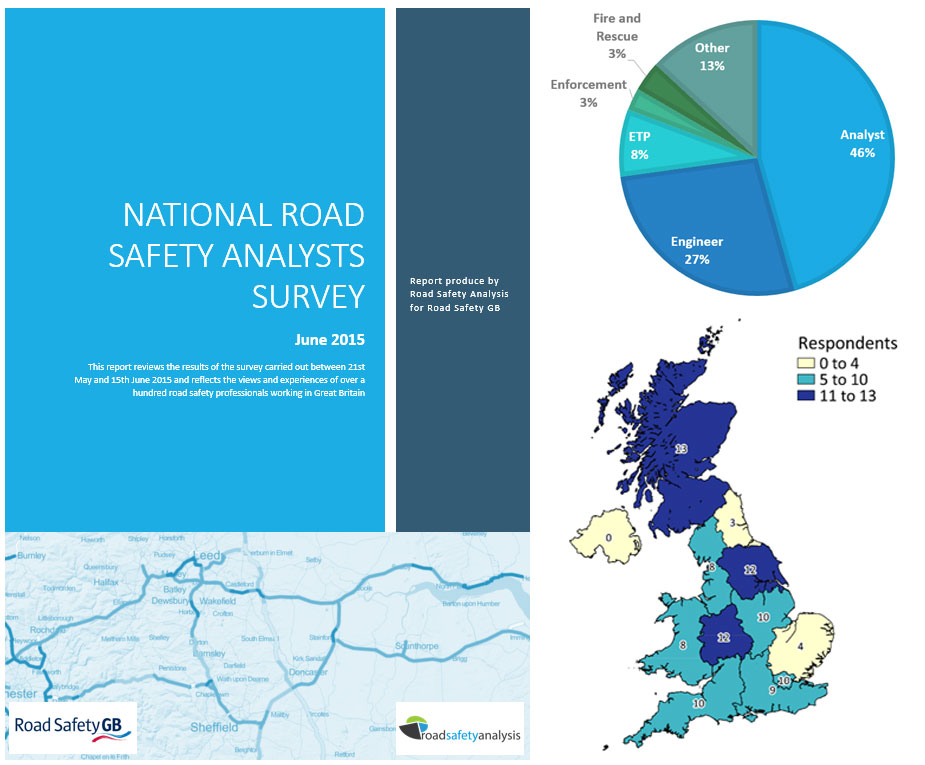
RSGB Analysts Survey – Full Results Published
July 22, 2015
RSA Director Receives Industry Recognition
October 5, 2015
Is the weather really to blame for the increase in road deaths in 2014?


There is a supposition that unusual weather events can have different impacts upon casualty numbers, for example:
- Heavy snowfall reduces the number of vehicles on the roads, as well as lowering average speeds. This could therefore be expected to reduce the number of casualties. This may be contrary to the outcomes expected by the public who are wary of driving in ‘difficult conditions’ and would perhaps expect lots more crashes (although these could include damage-only) when it’s icy.
- Hot, sunny weather encourages people to walk and cycle more, thereby increasing the numbers of these ‘vulnerable road users’ who can now be injured – mostly by vehicles.
- Wet weather would have the opposite effect, discouraging pedestrians and cyclists from making their journeys and pushing them to other methods of transport.
- Dry (although not necessarily hot) weather encourages more leisure motorcyclists to enjoy a ride out
These theories seem to make sense logically but do they reflect the picture on the ground in terms of casualties, and are these weather effects universal throughout the year?
Well, the DfT, together with the Office for National Statistics (ONS) have this year carried out an analysis ‘Modelling the impact of the weather on road casualty statistics’.
The report, and the technical companion document make interesting reading for those with an interest in road casualty data, meteorology and statistics.
In summary they looked at casualty totals on a month-by-month basis for pedestrians, cyclists, motorcycle users, and car occupants between 1979 and 2012; then matched these figures to average UK monthly rainfall and temperature figures for the same period.
There was a fair bit of statistical jiggery-pokery going on before they finally came up with their analysis which resulted in a lookup table that identified which users groups in which months may see their casualty totals affected by temperature or precipitation.

- The first example is cyclists. Pedal cycle users are only more likely to be killed when temperatures are one degree above average in January, March and December. At other times of the year, significant increases in temperature are not likely to have a statistically significant impact on cyclist fatalities. Cyclist injuries of other severities are more likely to be affected though with ‘slightly injured’ casualties rising in line with temperate in all months except November.
- Pedestrians seem to be less affected by the weather with only a handful of months showing significant increases when the weather is abnormal. What is interesting here is that rainfall has a negative impact on pedestrian casualties, going against our hypothesis that they would be less exposed as a group due to fewer pedestrian trips. This model shows that when rainfall (technically precipitation but this error has been missed by the DfT) is above average in January and February, more pedestrians are likely to be killed. No explanation of why this is the case has been included but you could speculate that pedestrians are more eager to cross the road quickly (and carelessly), or drivers could have their visibility affected or could be travelling to fast for the conditions.
- Motorcycle users show a high degree of fluctuation with positive and negative casualty impacts depending on the weather. There are more motorcyclists seriously injured when the temperature is higher than normal from February through to May, but less likely to be seriously injured when it is rainy in almost every month.
- Car users are, predictably, less affected by changes in ‘inconvenient’ weather fluctuations such as temperature with only a few months showing significant changes. Rainfall is a bigger factor in ‘serious’ and ‘slight’ collisions in most months however with negative patterns associated with more rain.
Many of us who have been involved in road safety for a while are instinctively aware of the effect of the weather. Unusually warm April weekends are often followed by dread on a Monday morning in many areas of the country, predicting there will be a fatal motorcycle report amongst the daily emails. Heavy snow leads to police and fire colleagues dealing with more shunts but fewer KSI collisions. As such, we at RSA have previously undertaken analysis to see if there were any correlations between annual peaks and troughs in collision involvement and the weather (using maximum and minimum temperatures and millimetres of rain recorded at a local weather station).
In 69% of months where there were higher numbers of Berkshire motorcyclists involved in collisions than average, there was less rainfall than average. Temperatures also seemed to have a correlation with collision involvement rates: 80% of troughs coincided with lower than average maximum temperatures. We concluded in 2013 that “whilst not conclusive, the analysis does seem to indicate that collision involvement increases in good weather, which might be a result of leisure riders making conscious decisions about which days to take the motorcycle out.”


So, how does the new weather analysis by the DfT affect those working in road safety at a local level?
If we are faced with higher than average motorcyclist casualties in a dry March should we just shrug our shoulders and say, “It’s nothing to worry about, it’s just the weather”.
I suspect that answer would be far from it. In some respects this could help target interventions during unusual months, helping us focus proactively on those road users more at risk.
Of course we actually need to know why the number go up or down; what factors are involved - was it due to driver behaviour or poor visibility?
It’s early days yet but we could in theory look at adding an ‘unusual monthly weather’ as a field to MAST which would help people analyse what happens in these months on more detail, although we would prefer to have more precise meteorological data first of all. One obvious filter that needs applying to the data is ‘was the road surface wet’ when looking at months with high rainfall. We will address the question of new analyses and MAST dimension at our spring conferences as usual - watch this space for more details on those soon.