National Analysts Conference
January 1, 2016
Can we rely on the DfT’s in-year provisional estimates?
February 4, 2016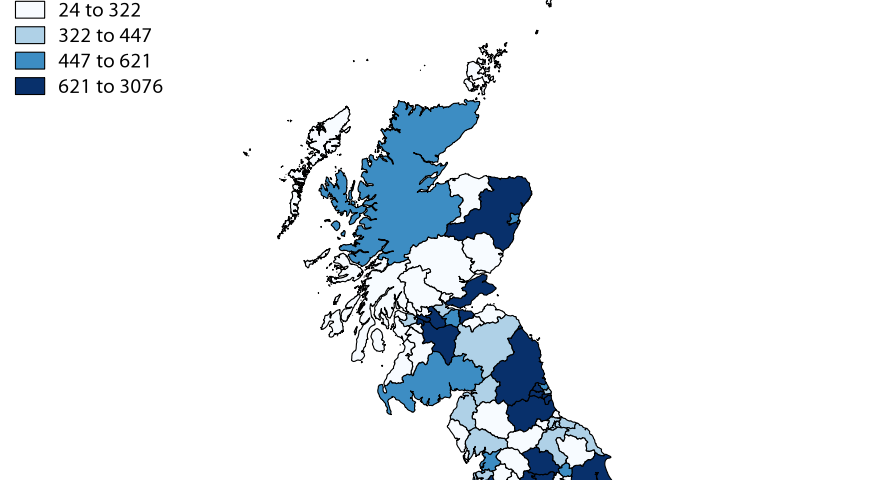
Visualising Road Safety Data with Maps

[iframe width=’100%’ height=’520′ frameborder=’0′ src=’https://aha83.cartodb.com/viz/5b716b7e-0b66-11e5-a84e-0e5e07bb5d8a/embed_map’ allowfullscreen webkitallowfullscreen mozallowfullscreen oallowfullscreen msallowfullscreen]
[/vc_column_text] [vc_column_text pb_margin_bottom=”no” pb_border_bottom=”no” width=”1/1″ el_position=”first last”]
The first shows the prevalence of crashes on the British Strategic Road network where ‘driver fatigue’ is one of the recorded contributory factors. There are some interesting trends to note here with motorways passing through more rural areas often showing up as having the highest percentage of fatigue crashes.
[iframe width=’100%’ height=’520′ frameborder=’0′ src=’//www.google.com/fusiontables/embedviz?q=select+col10+from+1CYFWyuCA1sFOJu0KP0HiqzVzYYQaftaNQKMsotN3&viz=MAP&h=false&lat=55.09292799017204&lng=-2.770971727050778&t=1&z=6&l=col10&y=2&tmplt=2&hml=KML’ allowfullscreen webkitallowfullscreen mozallowfullscreen oallowfullscreen msallowfullscreen]
The second shows HGV collision involvement on the strategic road network by traffic flow. Traffic flow is a very good way of measuring risk and comparing it between different roads and having this on a vehicle class basis is very useful in this instance.
[/vc_column_text] [vc_column_text pb_margin_bottom=”no” pb_border_bottom=”no” width=”1/1″ el_position=”first last”]
[iframe width=’100%’ height=’520′ frameborder=’0′ src=’//he1.risk-map.co.uk’ allowfullscreen webkitallowfullscreen mozallowfullscreen oallowfullscreen msallowfullscreen]
The third shows average distance from home of driver by Highways England network link. This requires the driver postcode data which is included in MAST, and this allows us to work out distances from home to the scene of the crash (as the crow flies).