New Open Data Portal for Road Safety Data
September 29, 2016
New RSA Report Analyses Average Speed Cameras
September 30, 2016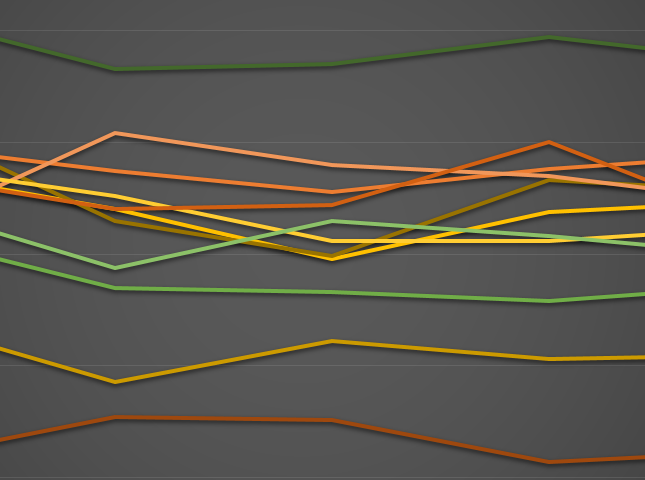
Can We Measure Local Variations In Fatal Casualty Trends
As road deaths appear to be remaining static, can we determine if regional differences are of significant interest?
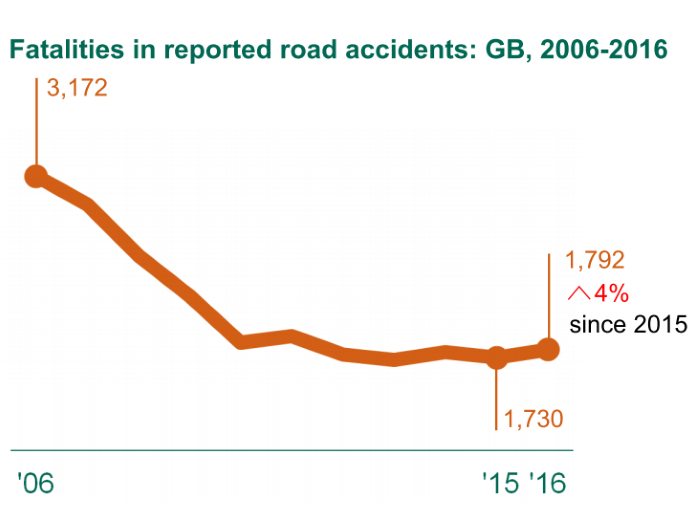
The last Thursday in September always marks the publication of the full Recorded Road Casualties Great Britain results by the Department for Transport and today they released the 2015 version. The report has moved on from being a series of charts and tables regurgitating data and now offers much more insight into why trends are occurring and inject a good amount of statistical techniques for good measure. I have previously commented on their insight into weather and the bottoming out of casualty reductions and now I want to consider if there is a regional trend that can be reliably analysed.
It is clear to see for anyone casually observing the trend line that since 2010 there hasn’t been a significant fall in the number of people killed on the roads. In fact the DfT say so themselves:
“There has been no clear trend in the number of fatalities since around 2011 (see front page chart). Prior to that, and particularly during 2006 to 2010, the general trend was for fatalities to fall. Since that point, though, most of the year on year changes are either explained by one-off effects (for instance, the snow in 2010) or natural variation. The evidence, points towards Britain being in a period when the fatality numbers are fairly stable and most of the changes relate random variation.”
The use of the term ‘random variation’ when referring to someone’s life is a little unfortunate but policy makers need to think carefully, and objectively when making decision about delivering interventions, whether they are based in engineering, enforcement or education. The problem is that when you look at small sample sizes, like annual number of people killed on local roads, then numbers to go up and down a bit.

It’s very simple to carry out a regional analysis of fatal casualties on road by region using the new RSA OpenData tool and I exported the data into Excel to produce the following chart demonstrating regional variations since 2011.
As you can see, the lines are rather confused an it’s difficult to observe clear trends. When looking at changes over a time period it’s often best to use a rolling average which flattens out the peaks and troughs, or you can produce a comparison of the combines years at the start and end of the periods. I chose to look at the average for 2011 and 2012 and compare that to 2014 and 2015.
The results in the table appear to show some big differences when expressed as percentages with a 4% drop nationally repeated almost everywhere else (Scotland saw a 2% rise). The region displaying the biggest drop was the West Midlands with an average of 159 fatal casualties on local roads in ‘14-‘15 versus 183 in ‘11-’12. The question though is, is this significant?

One way to quickly assess the level of potential variation in a single sample point is to use the built-in error bars function within Excel. In the example below I have used the Standard Error (which estimates how far the point is likely to be from the population mean), but you could choose the Standard Deviation too (which assesses the variation within all of the samples). To put it simply, if your bars overlap between years then there’s nothing to see and the result is within the realm of natural variation. This doesn’t however mean that if the point is outside of the error bars then ‘something significant has happened’, it just means it’s worth investigating further to see if there were any other influencing factors.

Actually the DfT have written another excellent article on ‘factors affecting reported road casualties’ and it’s definitely worth a read. We hope to review this in more detail in the coming weeks with a view to showing how local analysis can use similar techniques.
Going back to our dataset, you can of course drill down in more detail by police force and local authority. In the sample below you can see that within the unitary authority of Stoke, the number of fatal casualties has dropped from eleven in 2011 to three in 2015. Is this evidence of a significant change and in which case why has the change come about? Answering those questions is difficult but if the number increased to say, eight in 2016, would this be a significant problem? In the end it comes down to sample size and employing simple statistical tests, as well as some common sense, to determine whether there really has been a change in the frequency of road deaths. At that point you can then think about why that may have taken place and whether local changes have influenced the change.

As a final point of pedantry I would like to point out that actually we should be reviewing collisions on local roads rather than casualties as this is the measure of incident frequency, not the often random number of people who were sadly killed.