Motorcyclist Casualties – What’s Going On?
July 21, 2016
New Open Data Portal for Road Safety Data
September 29, 2016
Project EDWARD – A day without road deaths
Following two disappointing years of casualty statistics across Europe, TISPOL (the European Traffic Police Network) have introduced the European Day Without A Road Death (EDWARD) where they hope to focus attention on road user behaviour. They want organisations to promote the day and the message for road users to ‘think about the risk they face and the risks they pose to others’. There is also a target that no one should die on the roads of Europe on Wednesday 21 September 2016.
On average
5.29 deaths
Per September Wednesday 2004 - 2015
Given that there were nearly 26,000 people killed on Europe’s roads in 2015 the aim to achieve zero deaths is therefore symbolic, but the hoped-for publicity should help to focus minds on this tragic waste of life. If we turn our thoughts to home though we can consider whether a day without a fatality could happen in the GB*?
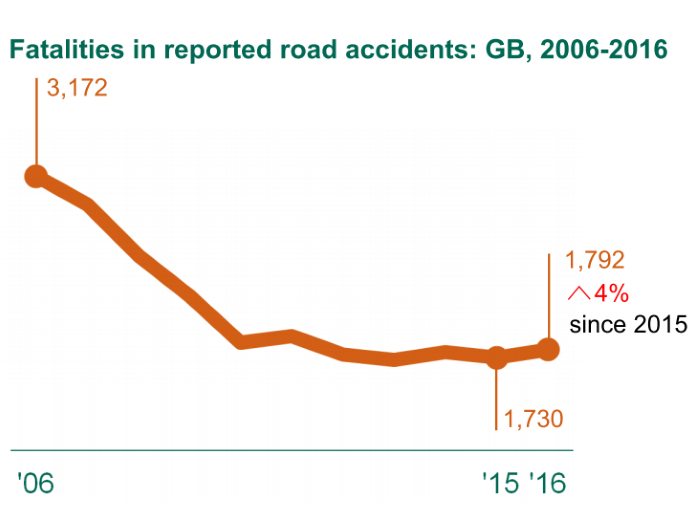
There were 1,732 road deaths in GB in 2015, a little under 5 per day so there is a chance that one or more days per year could feature zero deaths. Although it’s impossible to look at deaths on individual days in MAST, we can interrogate the database that lies beneath it. After a few minutes it was possible to identify four days in 2015 when no one died on GB roads, 17th January, 12th March, 9th June and 22nd October. That roughly means that there is a one-in a hundred chance of zero deaths occurring on GB roads today.
There is however seasonal variation in road deaths and it is possible in MAST to look at specific months and indeed days of the week. So I had a look at the statistics yesterday to see what the trends were for fatal casualties on Wednesdays in September since 2004.

One of the pre-requisites for an analysis like this is to first of all calculate the number of Wednesdays in each September, then calculate an average number of fatalities per day. This is important as it varies between 4 and 5 per month. The full list together with the raw data is included in this spreadsheet if you want to check my working-out.
Over the last 12 years there have been 275 road deaths in our September Wednesdays sample, which works out at 5.29 per day with 4.44 being in-occupant fatalities and 0.85 being pedestrians. The chart alongside shows the numbers for each year together with a predicted trend line for 2016. If you haven’t used the Forecast Sheet function in Excel 2016 it’s well worth a look by the way. It takes two series (in this case a time series) and calculates forwards or backwards with seasonal variations if required. It also adds confidence intervals, in this case at 95%. The model predicts 3.2 deaths today with an expected variation of between 0.67 and 5.72, so if there were zero deaths then this would be a very significant event. As our simple analysis of 2015 days without a death showed, there is a one in 100 chance of this occurring today so to see that possibility falling outside of the 95% confidence interval is to be expected.
The following sets of analysis breakdowns are of course subject to variation from the annual figures, but are included as an illustration of what can be achieved, as well as putting fatalities in our sample into context.
Regionally residents from the South East make up the highest proportion of fatalities in the sample, followed by the East. Remember, we have matched postcodes of those killed on the roads here, not mapped the location of the crashes. Those with an unknown or mis-coded postcode are not included in the chart below. Interestingly Northern Ireland makes the list, not because we have details of the crashes on NI roads but because we matched the postcode of a NI resident on GB roads.


The next breakdown covers age with child casualties making up the smallest proportion. It is clear to see the over-representation of young people in the casualty statistics here, even with such a small sample size. We have included results for journey purpose, despite that fact that it isn’t consistently recorded and many results end up in the ‘other’ classification. Where an alternative classification was coded then we can see that very few were school related and 21% were work-related (including commuting). These proportions are likely to be much higher but no investigation has been undertaken of the level of under-reporting f this STATS19 field.
30%
Motorcyclists
If pedestrians are excluded and we look at vehicle occupants, we can see that more than half of all fatalities were drivers or passengers in a car. Motorbikes make up a massively disproportionate number with 30% of all fatalities in our sample. The other significant group is cyclists with 8.7% (20 deaths in 12 years) which is lower than the previously-referenced pedestrians figure of 44. With pedestrians included it is worth noting that the figure for car occupants falls below 50%.


Finally we looked at where on the road network the fatalities took place. Sixteen percent were on the strategic road networks of England, Scotland and Wales with the rest occurring on local roads or on the TfL strategic network (this isn’t coded yet in MAST). Also most took place away from junctions (62%), with T-junctions and cross-roads making up 28%.

So, what does this micro-study of fatalities on Wednesdays in September tell us? Well, although it has been an interesting analysis to undertake, it is not one that I would normally recommend. Understanding week-day trends is a more reasonable approach, although there is good evidence that Fridays are a bit different to the other days of the week. It does show what is possible in MAST and also highlights problems associated with predicting trends when using small numbers. Our work increasingly uses statistical modelling techniques and we hope to bring forward features that help users understand whether the trend they are seeing is actually significant or just random variation.