A Road Safety Challenge for a New Government?
May 26, 2015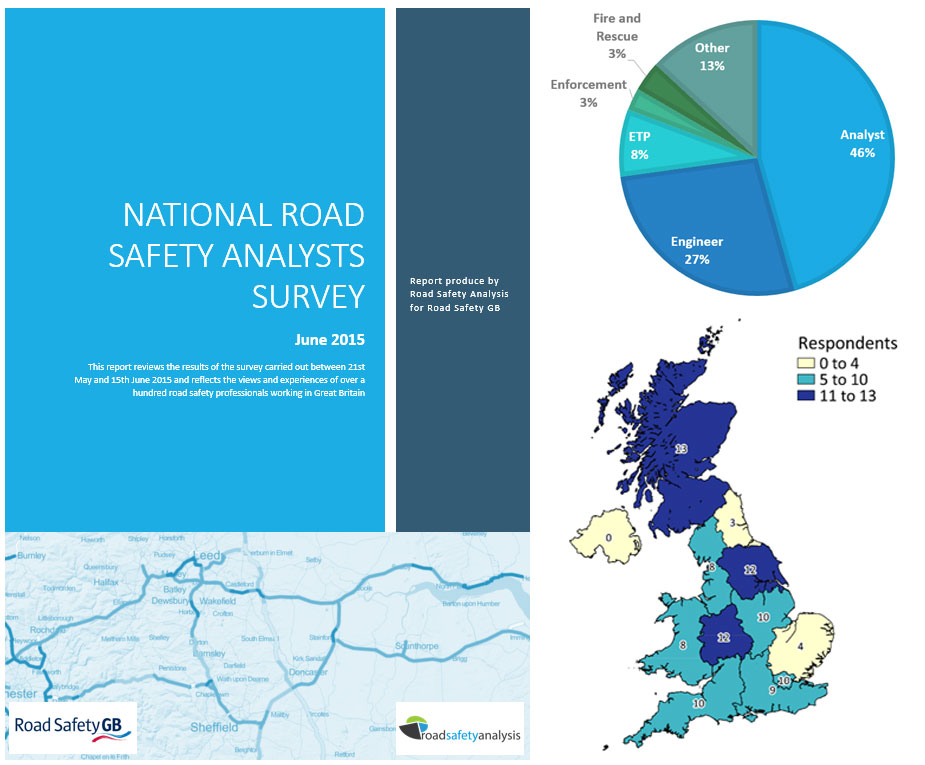
RSGB Analysts Survey – Full Results Published
July 22, 2015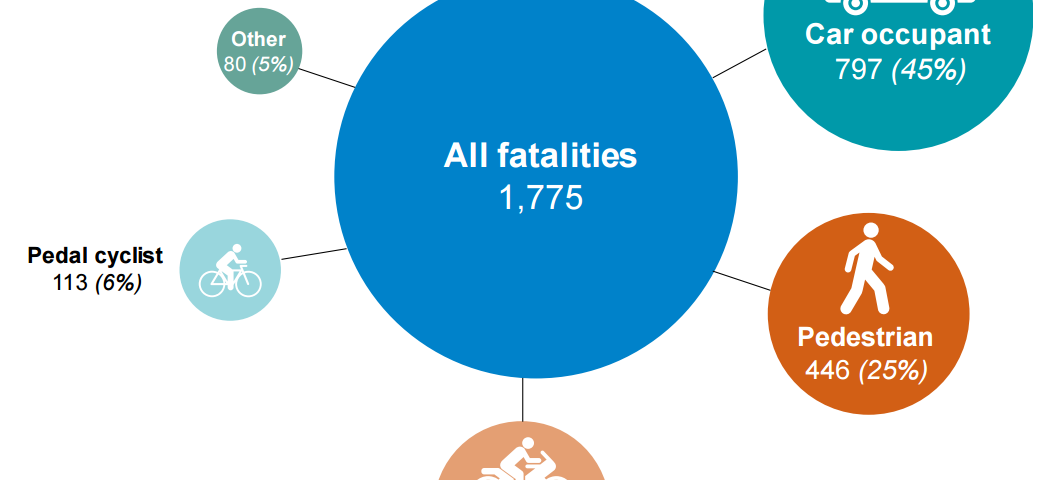
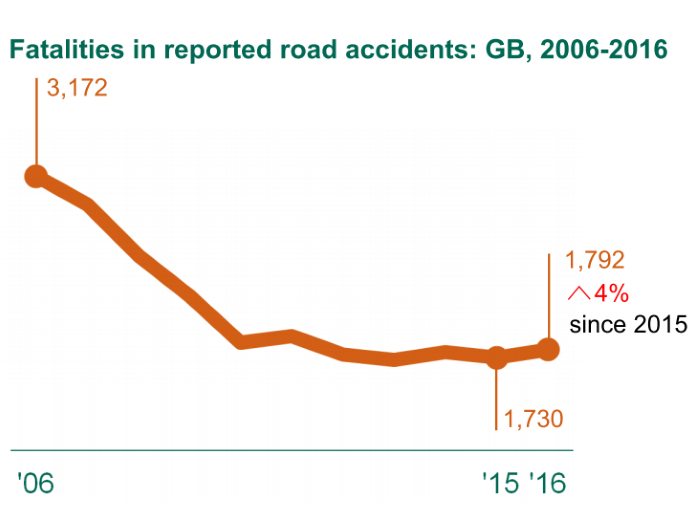
2014 Road Casualty Figures - Initial Analysis
- The number of people killed on the roads increased by 4%
- Pedestrian fatalities were up by 12%
- It is the first rise in seriously injured casualties since 1994
- The rise in ‘slight’ casualties in statistically significant
Delving deeper into the information reveals interesting subtleties and complexities in the data with the DfT themselves saying, “Interpreting the 2014 casualty figures is extremely challenging and there are a number of contradictory elements.”
Number of people killed on the roads
Number of pedestrian fatalities


Overall trends
Comparing year-on-year performance, especially with relatively small numbers such as those killed on the roads can be quite difficult and small variances lead to large changes in percentages which grab the headlines. One example picked from the release is a 53.2% rise in child casualties on motorbikes (an increase of 12 from last year’s figure). The total rise in fatal casualties of 4% is not statically significant at the 95% confidence interval but it’s quite close to being significant and given the rises in seriously and slightly injured casualties, this is worrying. In comparison to the 2005-2009 baseline there have, of course, been reductions but the trends since 2010 has been of no significant decrease, as pointed out be many road safety professionals over the past few years. So, is this new rise the beginning of a trend and where are the problem areas?
Before considering the individual groups, though, we need to put the results into context. It is important to remember that casualty risk is not proportionate to total distance travelled. As shown in the graphic below, vulnerable road users such as pedestrians, pedal cyclists and motorcyclists have higher casualty and fatality rates per billion miles travelled than other forms of transport. It is interesting to see that for 2014, pedal cyclists have a similar fatality rate per billion passenger miles as pedestrians but an overall casualty rate closer to that experienced by motorcyclists. This is actually good news for cyclists – whilst they are at an increased risk of injury per mile travelled than other modes of transport, the fatality: casualty ratio is lower than for pedestrians or motorcyclists.

The DfT state that,
“There was an 8.2% rise in the number of seriously injured pedal cyclists to 3,401 in 2014. With the exception of 2012 to 2013, the number of seriously injured pedal cyclists has increased every year since the low of 2,174 in 2004. This long term rise indicates that there is an ever increasing problem with pedal cyclist casualties.”
The total number of reported pedal cyclist casualties rose by 9.5% to the highest number since 1999 and represents a 31% increase since 2007. This road user group is the only one with casualty numbers above the 2005-09 average.
“On-road pedal cycle traffic rose by 3.8 per cent to 3.25 billion vehicle miles in 2014. This means that cycle traffic has risen by 27 per cent since 2007, not far short of the 31 per cent rise in casualties over that period. It is likely that the increase in cycling has resulted in more accidents as cyclist become more exposed to motor vehicle traffic.”
However, whilst cycling traffic has increased since 2007, there has been a divergence between the number of serious casualties and observed pedal cycle traffic – the number of casualties appears to be outstripping cycling rates. It could suggest that ‘safety in numbers’ isn’t working (at least with modest rises) and that additional infrastructural and psychological changes need to be made before the positive effects of increased cycling can be experienced in Britain.

Why has there been an increase?
Towards the end of the report the DfT state several reasons why casualty numbers reduced throughout the last decade and these included the economic recession, lower average speeds, greater compliance with speed limits, technological and engineering improvements, improved education and training, and finally improvements in trauma care.
The suggestion here is therefore that perhaps we have done as much as we can in these areas as casualty reductions slowed to a half in this decade.
If the last five years have generally seen static numbers, there have definitely been fluctuations between years which can be explained largely (according to the DfT) to weather events. They say that, “Typically, bad weather usually results in a reduction of accidents as the reduction in exposure and driving speeds usually outweighs the increased inherent risk of poor road conditions”. This can clearly be evidenced in the winter of 2010, which was particularly bad and resulted in large falls in casualties on the roads. In 2014 temperatures were slightly higher than normal and there were no significant snowfall events, at least in the most populated areas of GB. Rainfall was very high in the early months of the year but this isn’t cited as a reason for any change in casualties.
It is true that the slightly warmer temperatures have coincided with an increase in cyclists and motorcyclists but the numbers are quite small.
One other interesting trend noted by the DfT is that up until November 2014 the fatality figures were looking pretty much consistent with those for 2013, but then November and December saw a big rise. This was most clearly evidenced in the pedestrian fatality figures where in those two months alone there were 139 pedestrians killed on our roads.
Weather is an influencing factor therefore but this is measurable by looking at the traffic data which only showed an increase of 2.4%. True, this is the biggest rise in traffic on our roads since 1996 but it’s much lower than any of the increased casualty figures.
There is therefore an unexplained gap which manifests itself in increased casualty rates. As already mentioned, these are highest among cyclists where it is becoming increasingly less safe to cycle. These risks need to be put into context, though, as cycling is actually safer than walking, mile per mile.
We have had good progress in reducing injury rates for those using motorised transport, even for motorcyclists, but it is the vulnerable road users who have been left behind. If strategy leads are looking for areas to target it seems clears there are greater opportunities to improve in the areas of cyclists and pedestrians than in the other groups.
Charts and graphics produced by the Department for Transport