National Analysts Conference
January 1, 2016
Can we rely on the DfT’s in-year provisional estimates?
February 4, 2016
National Analysts Conference
January 1, 2016
Can we rely on the DfT’s in-year provisional estimates?
February 4, 2016
Show all

Visualising Road Safety Data with Maps

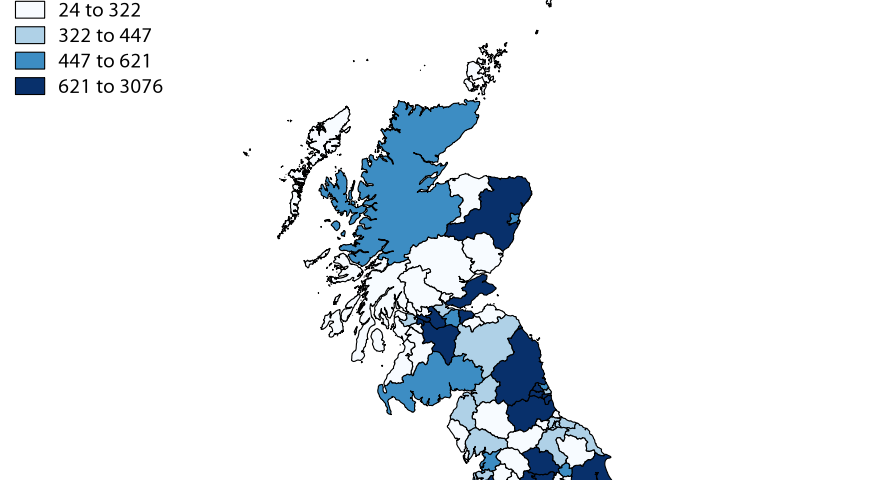
One of the most popular ways of visualising data is on a map. Many of the fields in STATS19 can be mapped using data obtained from MAST Online. The Office for National Statistics (ONS) provides shapefiles for different levels of British geography, for example Local Authority District, which can be used to create thematic maps with STATS19 data. In the below example, crash location data was obtained from MAST by clicking on the Crashes tab and drilling down in to the Crash Location dimension, selecting ‘Authority ONS Code’ in the rows tab, and applying filters for Crash Date (2010-2014) and Crash Involved Young Driver (Yes). The data can then be extracted from MAST via the ‘Download Excel’ link. The data can then be imported in to a desktop GIS program such as QGIS or MapInfo and linked to the district authority shapefile. These programs can then be used for styling and labelling to create a thematic map, similar to the one shown below, showing numbers of collisions involving young drivers by local authority district.

Visualising Road Safety Data with Maps
As this map only shows total numbers it tends to show areas where population is higher or where there are more roads. It would be more useful to create a rate of young driver collision involvement by population or road length. The ONS and the Department for Transport (DfT) publish figures on population, road length and traffic flow, which can all be used to calculate suitable denominators for creating thematic maps, although road length and traffic flow are only available at highway authority level. Using data from MAST and some of the mapping layers we have created over recent years we have created a number of bespoke maps of the strategic road network across Great Britain.

Each map utilises a different web mapping application. The three examples use CartoDB, Google Fusion Tables and the QGIS2Leaf plugin for QGIS.  There are a variety of functions available across the three maps including: location search; zoom control; legend; pop-up information box; and layer control. These open source public GIS solutions are very useful for road safety practitioners who want to quickly visualise their results using basic tools, with the option for web display highly valuable. More advanced mapping projects require the use of a dedicated server which can be expensive to run.  Road Safety Analysis have recently rolled out a new GIS platform which is being used to showcase risk mapping at a local authority level, samples of which can be seen here. If you would like to know more about using MAST to map casualty data or if you would like to talk to us about bespoke GIS projects please get in contact.


[iframe width=’100%’ height=’520′ frameborder=’0′ src=’https://aha83.cartodb.com/viz/5b716b7e-0b66-11e5-a84e-0e5e07bb5d8a/embed_map’ allowfullscreen webkitallowfullscreen mozallowfullscreen oallowfullscreen msallowfullscreen]


[/vc_column_text] [vc_column_text pb_margin_bottom=”no” pb_border_bottom=”no” width=”1/1″ el_position=”first last”]

The first shows the prevalence of crashes on the British Strategic Road network where ‘driver fatigue’ is one of the recorded contributory factors.  There are some interesting trends to note here with motorways passing through more rural areas often showing up as having the highest percentage of fatigue crashes.

[iframe width=’100%’ height=’520′ frameborder=’0′ src=’//www.google.com/fusiontables/embedviz?q=select+col10+from+1CYFWyuCA1sFOJu0KP0HiqzVzYYQaftaNQKMsotN3&viz=MAP&h=false&lat=55.09292799017204&lng=-2.770971727050778&t=1&z=6&l=col10&y=2&tmplt=2&hml=KML’ allowfullscreen webkitallowfullscreen mozallowfullscreen oallowfullscreen msallowfullscreen]

The second shows HGV collision involvement on the strategic road network by traffic flow. Traffic flow is a very good way of measuring risk and comparing it between different roads and having this on a vehicle class basis is very useful in this instance.


[/vc_column_text] [vc_column_text pb_margin_bottom=”no” pb_border_bottom=”no” width=”1/1″ el_position=”first last”]

[iframe width=’100%’ height=’520′ frameborder=’0′ src=’//he1.risk-map.co.uk’ allowfullscreen webkitallowfullscreen mozallowfullscreen oallowfullscreen msallowfullscreen]

The third shows average distance from home of driver by Highways England network link.  This requires the driver postcode data which is included in MAST, and this allows us to work out distances from home to the scene of the crash (as the crow flies).