MAST Professional Goes Live
December 3, 2013
MAST Provisional and MAST Scotland
January 17, 2014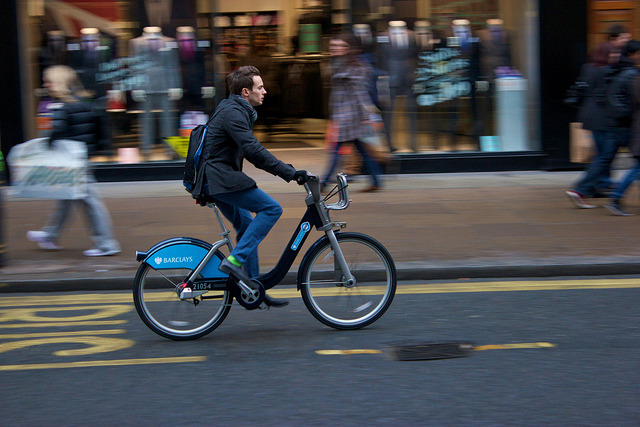
Exploring Responsibility For Cycle Crashes – An Objective Approach
Written submission by Bruce Walton, Director, Road Safety Analysis, 25 November 2013
To the Transport Select Committee Session on Cycling Safety, 2nd December 2013
Introduction
The ongoing public dialogue around cyclist safety has generated more heat than light. Much discussion of the topic seems to reflect a “Two Tribes”[1] mentality: many drivers and cyclists alike perceive themselves as blamed and bullied, and in response have adopted an entrenched approach to the debate. At the heart of this dichotomy lies both sides’ convictions that cyclist injuries are mainly ‘the other guy’s fault’: many cyclists feel that drivers treat them with reckless contempt; many drivers have countless tales of cyclists who ignore the rules of the road; both sides are quick to accuse the other of aggressive and irresponsible behaviour. This febrile atmosphere has only increased with the recent tragic spate of cyclist deaths.
The present climate of the cycling safety debate presents government with significant political challenges. Many proposed interventions intended to improve cycling safety could be perceived by one or both sides of the debate as an accusation of blame against them. The consequent vitriolic attacks will only serve to make consensus and acceptance even harder to achieve. Given that any government action is likely to include a range of measures which need to win broad acceptance in order to be effective, a stormy reception of this kind is likely to weaken their long term effect on casualty reduction. An intelligence led approach based on objective information is prerequisite for quenching these flames.

Cyclist Image by [Futureshape]
Purpose
This submission provides fact based information which intends to elucidate the extent to which the actions of various road users influence injury crashes. It is indicative of a direction of travel which this debate may take in the future. If all concerned parties are informed by home truths about what is actually occurring on Britain’s roads, it may become easier for government, road safety stakeholders and mainstream public opinion to coalesce around an agenda for effective future action.
Road Safety Analysis (RSA) is a not-for-profit company which provides quality analytical and educational products and services, notably the award-winning web-based analysis tool MAST Online, to the British road safety profession. In order to elucidate the impact of both driver and cyclist behaviour on road risk, RSA has sought to examine the factors which contribute to incidents which resulted in injury and involved both motor vehicles and pedal cycles. It is hoped that this evidence will shed some light on the heated ‘blame game’ which sometimes breaks out between groups representing road users, leading to an increased sense of joint responsibility for use of shared space and mutual respect for the dangers and difficulties faced by others.Methodology
This information is derived from STATS19 data supplied by the Department for Transport to RSA for dissemination to the road safety community via inclusion in MAST Online. This data includes contributory factors recorded under STATS19, which are not available to the general public for data protection reasons but are included in an anonymised summary configuration in MAST, with access restricted to public sector road safety professionals only.
This evidence deliberately includes all qualifying police attended incidents, even where the actual degree of injury inflicted was not particularly severe. About five-sixths of the casualties in these incidents were recorded as ‘Slight’; this classification includes injuries such as whiplash, shallow cuts, sprains, bruising and shock requiring roadside attention. This choice was made for several reasons:
- There is a natural tendency for incidents which result in death to command widespread media attention, but thankfully such events are relatively rare. There is a danger that conclusions based exclusively on the circumstances of such a small number of incidents will not be representative of the actual experience of most road users.
- Each incident resulting in slight injuries represents an instance of failure in the system inducing actual harm. Given the relatively high frequency with which such failures occur, it seems prudent to examine what is known about them in order to glean information about prevalent trends in tangible road risk.
- There is a real possibility that reliance on reported injury severity alone to judge the significance of crashes can result in important information being overlooked. For instance, this can occur in circumstances where more serious harm was avoided only through good fortune, or where casualty severity misreporting may result significant incidents being recorded as ‘Slights’.
Up to six contributory factors (CFs) can be recorded by a police officer who attended the scene of an injury crash, each related to a participant (vehicle, driver, rider, passenger or uninjured pedestrian). It is important to appreciate that CFs reflect the officer's opinion at time of reporting and may not be the result of extensive investigation. Therefore, they should be regarded only as a general guide to the factors most likely to feature in incidents, rather than a definitive explanation for them. However, in the last seven years attending officers have recorded CFs for over nine hundred thousand injury crashes, making them by far the most extensive and inclusive basis for examining the issues which typically precipitate system failure and result in injury.
This preliminary examination included CFs recorded by all police officers who attended injury crashes on Britain’s roads over the last seven years (2006 to 2012) which involved two vehicles, one of which was a pedal cycle and the other either a car or a goods vehicle. This sample included 67,882 police attended crashes, encompassing a total of 135,764 individually attributed CFs.
The analysis divides CFs into two broad categories:
Those which the officer attributed directly to driver or rider behaviour at the time of the incident, including:
- Error or reaction; for example ‘Failed to look properly’, ‘Failed to judge other person's path or speed’ or ‘Poor turn or manoeuvre’
- Injudicious action; for example ‘Travelling too fast for conditions’, ‘Following too close’ or ‘Cyclist entering road from pavement’
- Behaviour or inexperience; for example ‘Careless, reckless or in a hurry’ or ‘Learner or inexperienced driver/rider’
- Impairment or distraction; for example ‘Impaired by alcohol’, ‘Distraction in vehicle’ or ‘Cyclist wearing dark clothing at night '
Those related to the circumstances or environment which may fall beyond the immediate control of drivers and riders, including:
- Affected vision; for example ‘Stationary or parked vehicle(s)’ or ‘Dazzling sun’
- Road environment; for example ‘Slippery road due to weather’ or ‘Road layout e.g. bend, hill, narrow carriageway’
- Vehicle defects; for example ‘Defective brakes’
- Other circumstances, including factors relating to pedestrians
CFs which were attributed directly to a driver or rider were then grouped by vehicle type:
- Pedal cycles
- Cars (including taxis, hackney carriages and private hire vehicles)
- Vans (goods vehicles licensed for private and light goods use, up to 3.5t max. gross weight)
- Lorries (goods vehicles over 3.5t max. gross weight, determined from tax disk or DfT plate)
Edmund King, President of The AA, Autumn 2012 [http://autumn2012.theaamagazine.com/edmund-king.php]
Findings
61,792 two vehicle injury crashes involving a pedal cycle and a car were analysed. The overall proportion of cyclist injuries to other road users in these incidents is a stark warning of the vulnerability of cyclists in the event of conflict with a motor vehicle. These crashes resulted in 63,305 casualties, of whom 97% were cyclists. 17% of these casualties were either killed or seriously injured, of whom 98% were cyclists. 369 people were killed in these crashes: all bar one were cyclists.

Figure 1
includes all these crashes, grouped depending on the category of CFs reported by the attending officer: those attributed to the driver (orange circle); those attributed to the cyclist (blue circle); and those classified as environmental factors which may fall beyond the control of either (green circle). An incident could fall into more than one category, with over two thousand crashes falling into all three.The following conclusions can be drawn:
- Driver behaviour contributes to more than six crashes out of ten: the attending officer attributed at least one CF to the car driver in 62% of crashes.
- Cyclist behaviour contributes to almost half of all crashes: the attending officer attributed at least one CF to the cyclist in 48% of crashes
- Driver and rider behaviour alone explain more than three quarters of crashes, to the exclusion of external explanations: environmental factors are only reported in 24% of cases

Similar analyses were conducted on 4,393 crashes involving a cyclist and a van, and 1,697 crashes involving a cyclist and a lorry. The resulting casualties are indicative of even greater risk of severe cyclist injury: in crashes with vans killed and seriously injured cyclists accounted for 19% of all casualties, while in crashes with lorries 38% of casualties were killed and seriously injured cyclists. 151 cyclists were killed in crashes involving lorries, almost 9% of all casualties from these incidents; while 52 cyclists were killed in collision with vans.
Figure 2
shows crashes involving cyclists and lorries, grouped depending on the category of CFs reported by the attending officer: those attributed to the lorry driver (yellow circle); those attributed to the cyclist (blue circle); and those classified as environmental factors which may fall beyond the control of either (green circle).
Figure 3 shows crashes involving cyclists and vans, grouped on reported CF categories: those attributed to the van driver (grey circle); those attributed to the cyclist (blue circle); and those classified as environmental factors (green circle).
The following conclusions can be drawn:
- The balance of contributing parties is broadly similar across all vehicle types
- A significantly greater proportion of van drivers contributed to crashes, compared with drivers of other types of vehicle: they contributed to 69% of all crashes involving a van and cycle, and the ratio of crashes involving van driver behaviour only was almost two to one compared to those involving cyclist behaviour only
- Crashes involving cyclists and lorries tend to involve a more complex mixture of factors: only 59% of crashes involved a single party’s actions, compare to 64% of crashes involving cars
Conclusions
While there is a great deal more to explore, these brief findings make is abundantly clear that any strategy must take account of the role played by human behaviour if it seeks to address the principal factors involved in cyclist safety. While there is no single simple explanation for why crashes involving pedal cycles occur, the evidence provides clear signposts which point the way for both future debate and ultimate action.
The most important points are:
- Most crashes result from human error: environmental changes alone cannot achieve dramatic casualty reductions, as changes in attitude and behaviour will also be required
- Driver behaviour causes cyclist injury more often than cyclist behaviour does: the ‘urban myth’ implying that cyclist behaviour is the main cause of cyclist injury does not stand up to scrutiny
- Cyclists are not simply victims of driver behaviour or environmental difficulties: a large minority of crashes involving cyclist injury involve cyclist behaviour in whole or part
- Collision with goods vehicles poses a higher risk of serious cyclist injury than collision with cars: van driver behaviour contributes more often than for other drivers, while factors contributing to crashes with lorries are more nuanced