
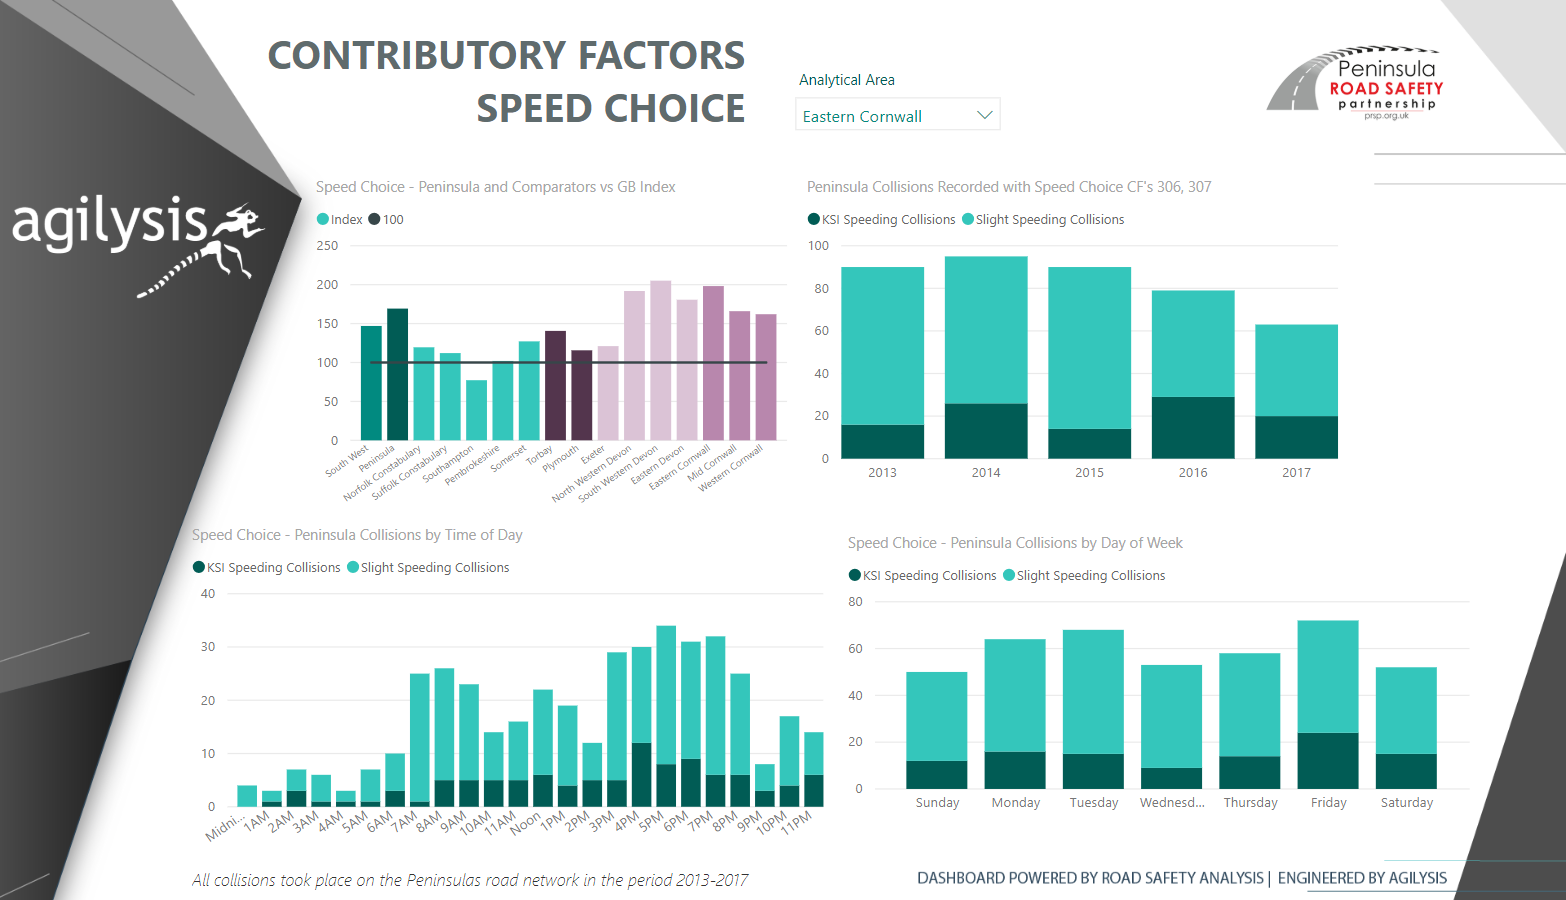
AREA PROFILE DASHBOARDS 
These detailed PowerBi dashboards are based on our Area Profile Reports and are an excellent way to explore data relating to collisions and casualties in and from a specific area.
The most simple dashboards focus on a single highway authority, although there are options for combined dashboards for larger areas, as well as the opportunity to look in more detail as smaller areas within an authority.
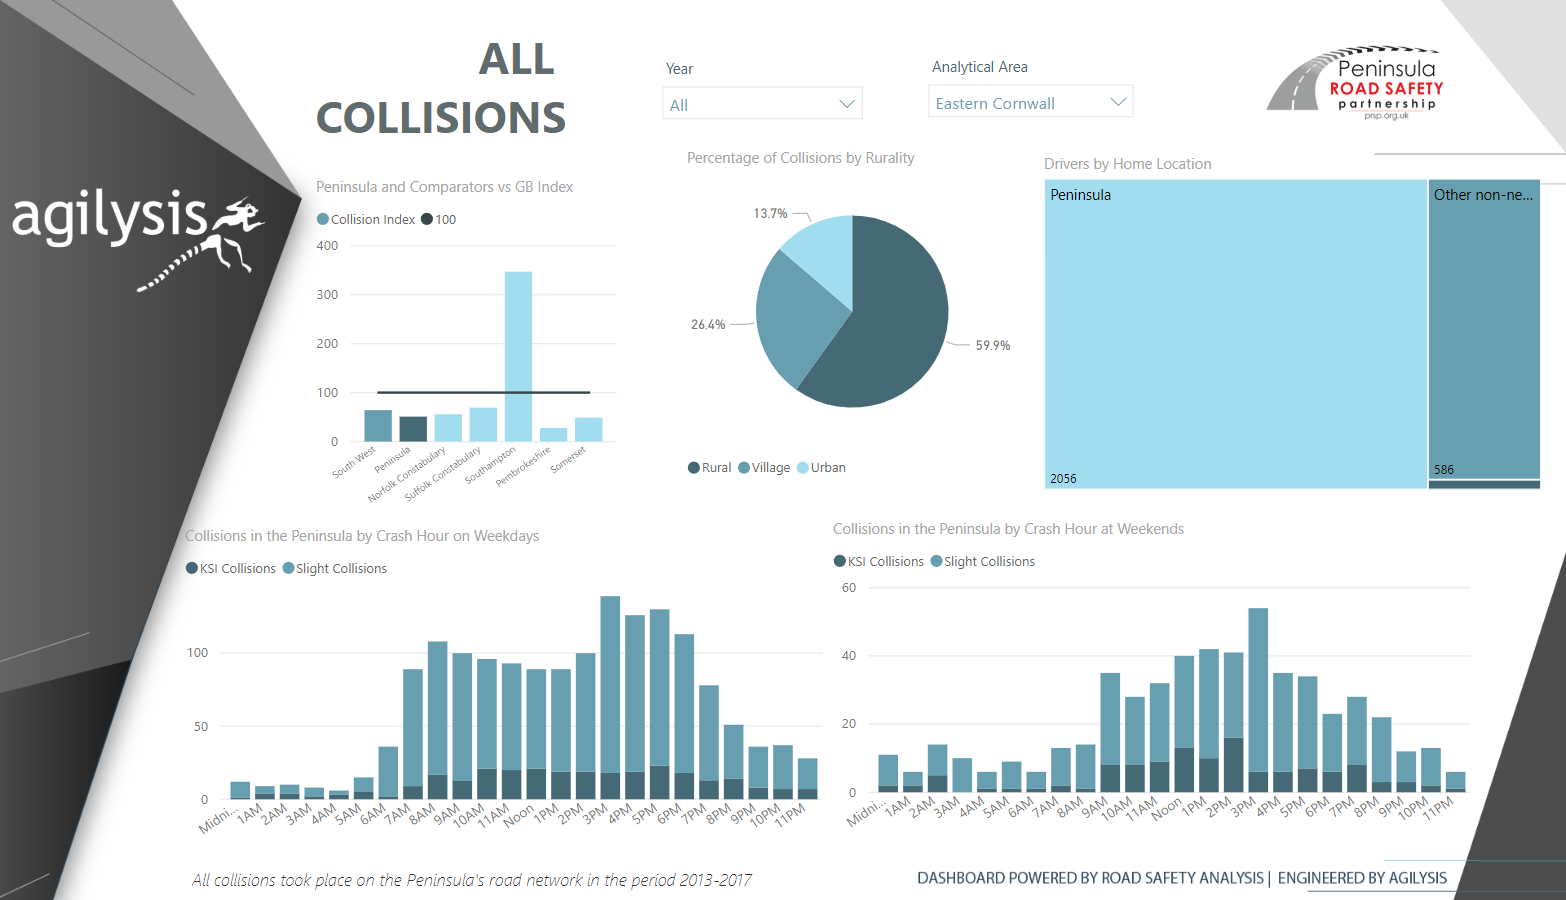
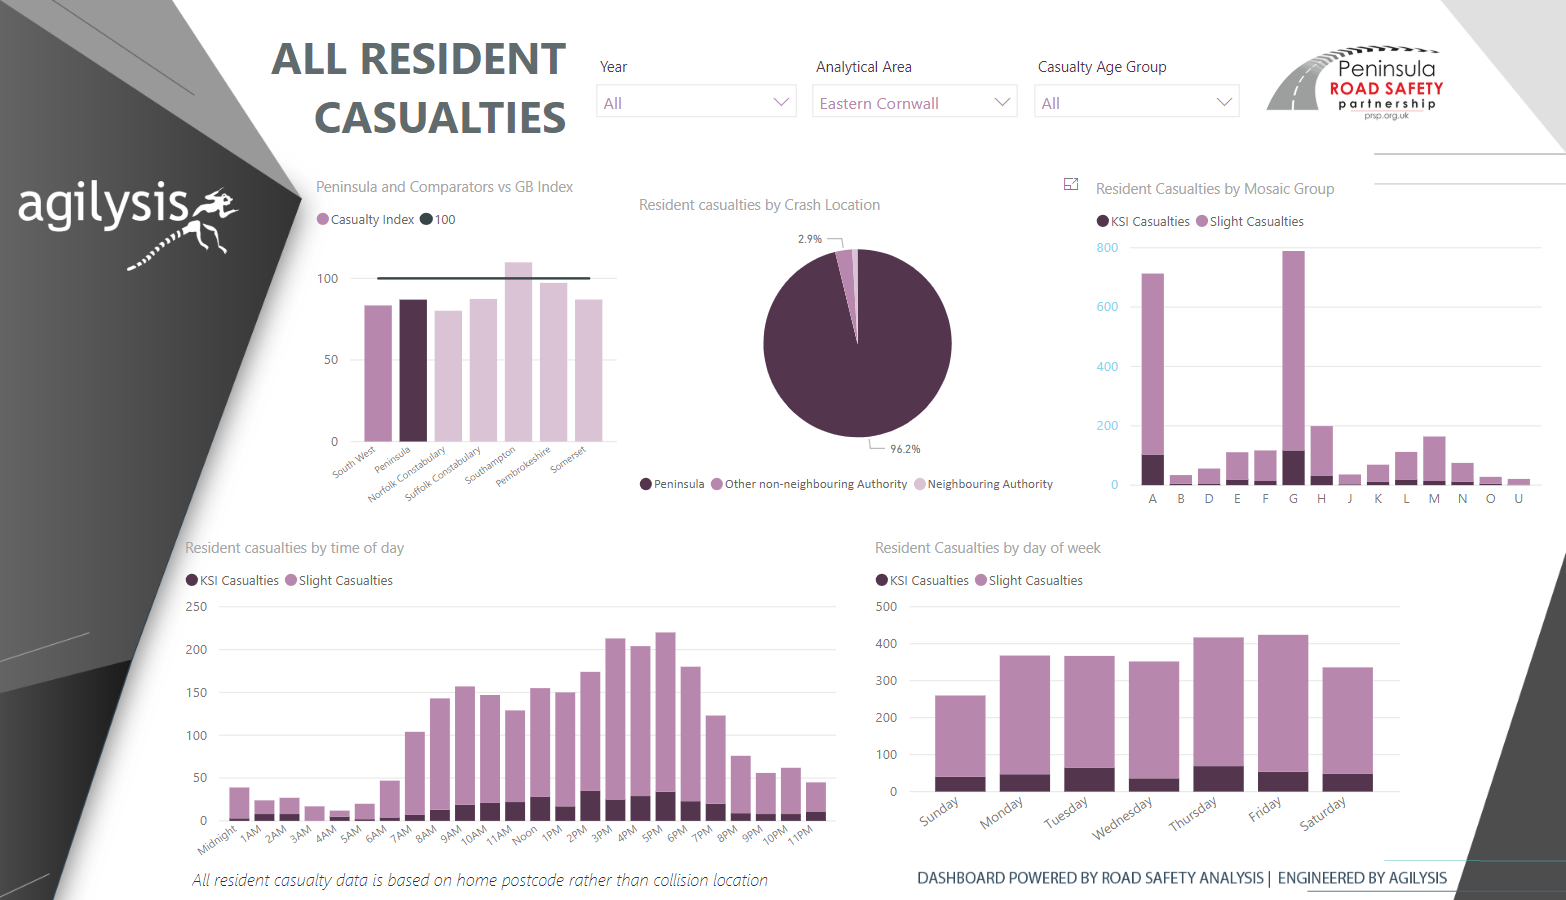
Users are greeted by an initial page comparing injury-involvement rates for all resident casualties against the GB and regional average.
For single-authority dashboards a number of suitable comparator authorities are selected based on road network similarity. For multi-authority dashboards the areas are simply compared against GB and each other.
Each of the user group dashboards can be filtered by year or age group and include time of day, day of week, mosaic group, and crash location. The collision location dashboard features an analysis of rural/urban, speed limit, weather, light, junction.
Each dashboard suite includes:
Your dashboard also includes Three Contributory Factor analyses from the following:
PRICING
- Detailed PowerBi dashboards based on our Area Profile Reports
- An excellent way to explore data relating to collisions and casualties in and from a specific area
- Simple dashboards focus on a single highway authority
- Options for combined dashboards for larger areas