
How Does Daylight Saving Time Affect the Safety of Britain’s Roads?
February 8, 2012
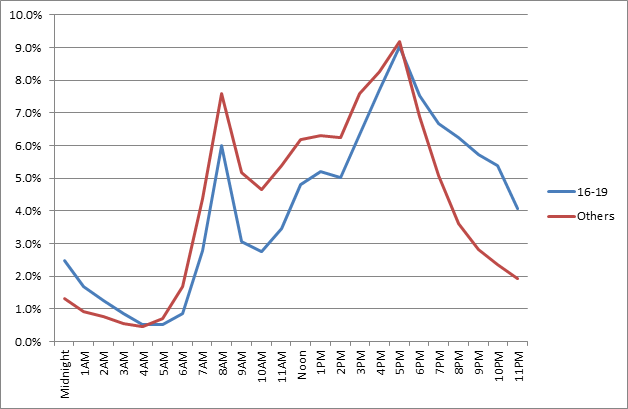
High Risks for Rural Young Drivers
February 10, 2012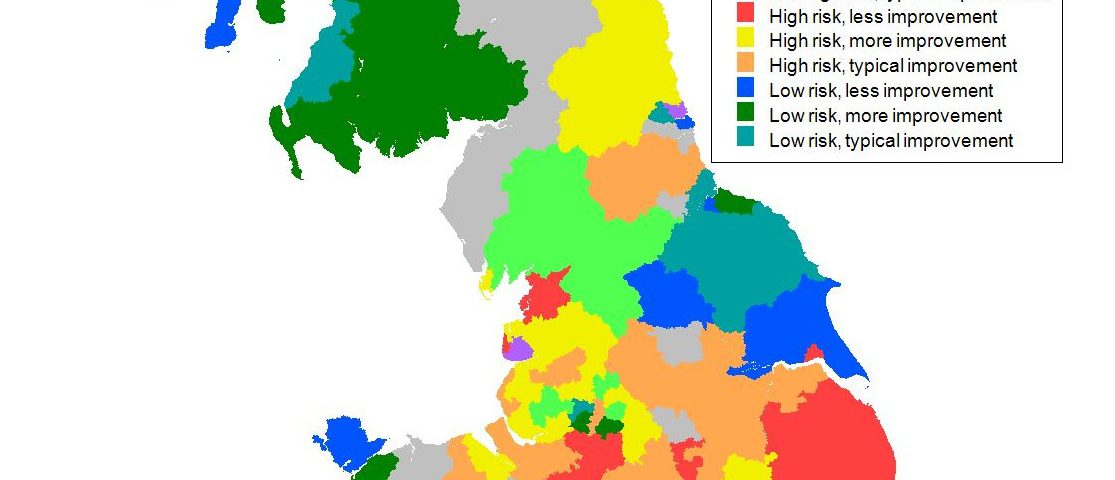
National Road Safety Performance 2011
Study Shows Nationwide Inequalities.
First independent analysis using new Department for Transport Key Outcome Indicators reveals huge variations in road safety risk across the country
Road Safety Analysis reveals today how local road safety performance has differed across the country over the last five years[1]; this information is now available to the public and local authorities via an interactive mapping tool, or as a league table of performance.
The results reveal that per head of population, casualty rates are four times higher in the Borough of Westminster, North Yorkshire and Powys than in areas such as Plymouth, East Dunbartonshire and Torfaen.
Analysis of casualties based on traffic rates highlight Lambeth, Blackpool and the Isle of Wight as performing up to five times worse than South Gloucestershire, West Berkshire and Newport.
The research is based on five years’ data during which time over 150,000 people have been Killed or Seriously Injured (KSI Casualties) on Great Britain’s roads. The results are expressed as rates, depending on local traffic and population counts, enabling a more accurate comparison of risk to be made for the first time.
The Department for Transport states that these indicators have been, “designed to help Government, local organisations and citizens to monitor the progress towards improving road safety and decreasing the number of fatalities and seriously injured casualties on Great British roads”, and therefore this report marks the first step in this process.
This study has been conducted by Road Safety Analysis a year after their ground-breaking, “Child Casualties 2010”[2] report which attracted widespread attention around the country[3]. This new report uses information derived from the award-winning[4] MAST Online collision analysis system, used by road safety professionals nationwide.
The mapping technology deployed to present the information has been licenced from international experts in online GIS solutions, eSpatial, and is an exciting preview of the new MAST Mapping service to be rolled out to MAST Members in the autumn.
Richard Owen, director of Road Safety Analysis says, “The results of this study show a worrying discrepancy between different parts of the country. Road users in some areas experience considerably higher risk from road traffic crashes than others who might be living just over the border. With the help of this sort of information, Local Authorities can develop a much better understanding of the risks experienced by their residents and road users, helping them to address the inequalities that many people are experiencing.”
For a copy of the full results including a breakdown of casualty rates for all 206 highway authorities, visit our mapping page: [https://www.roadsafetyanalysis.org/mapping/]
[1] Data covers the ‘benchmark period’ of 2005-2009 as set out by the Department for Transport in their Strategic Framework for Road Safety - [http://www.dft.gov.uk/publications/strategic-framework-for-road-safety] [2] [https://www.roadsafetyanalysis.org/2010/08/child-casualties-2010/] [3] [http://www.bbc.co.uk/news/uk-10989119] [4][ https://www.roadsafetyanalysis.org/2011/06/ciht2011/]
