MAST Online undergoes significant overhaul
September 5, 2013
National Signposts 2013
November 22, 2013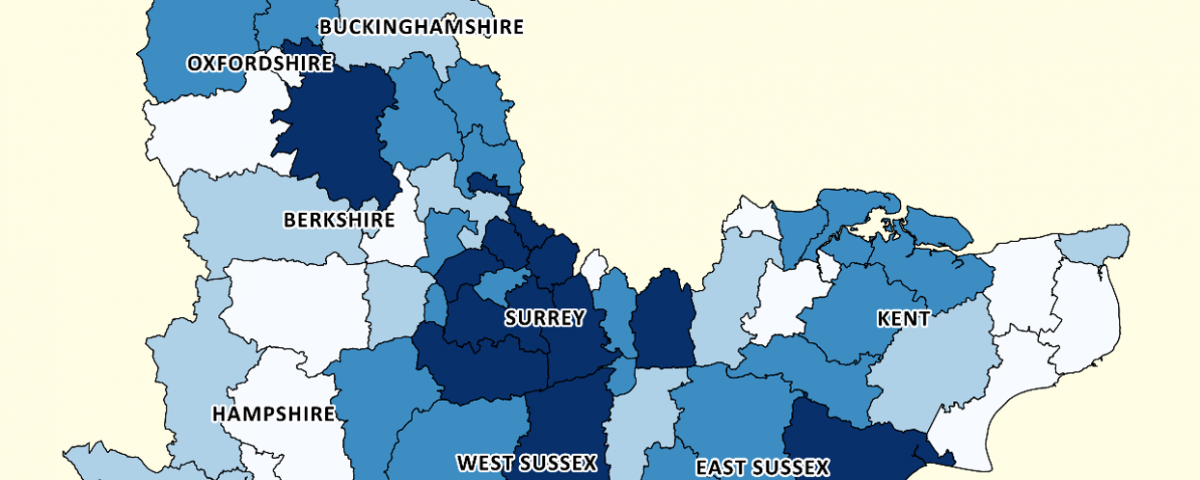
Driver Impaired by Alcohol - South-East England Case Study
We were approached by the award-winning [Don't Be That Someone] team who were interesting in finding out more about 'drink-drive' statistics in the South East of England. With the recent inclusion of contributory factor data in MAST Professional we were interested to find out how quickly an effective analysis of risk could be carried out. We were also more than happy to help this good cause who, with limited resources, wanted to ensure their education messages were effectively targeted.


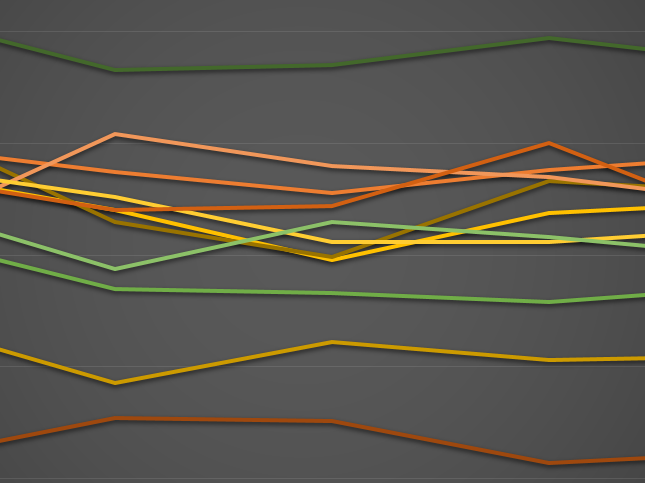
All Crashes vs Impaired by Alcohol Crashes
The chart above shows crashes involving one or more driver who was recorded as being ‘impaired by alcohol’ by the recording officer. Only crashes attended by a police officer are included. For comparison, the overall crash trend is shown, with the axis scaled so that the 2008 values are level.
Between 2008 and 2012 there was a total of 94,343 crashes attended by an officer with at least one contributory factor recorded in the South East of England (excluding London). There were 5,091 crashes where one or more driver was deemed to be impaired by alcohol, which is 5.4% of all crashes.
‘Impaired by alcohol’ drivers by residency
In the Southeast, 2.7% of all drivers involved in crashes were deemed to be impaired by alcohol over the past five years (2008 to 2012).
There are 8,634,750 (8.6 million) people living in the South East (excluding London) according to the ONS 2011 mid-year estimates. Between 2008 and 2012 there were 4,112 drivers involved in crashes who were deemed to have been impaired by alcohol. This equates to 95 drivers per million people per year recorded as ‘impaired by alcohol’ in the South East between 2008 and 2012. This has been broken down by local authority district and is shown in the below map. Runnymede Borough in Surrey has the highest rate with 156 impaired by alcohol drivers per million people per year. Gosport Borough in Hampshire has the lowest rate with 53 impaired by alcohol drivers per million people per year.

Only drivers of vehicles involved in crashes where an officer attended and where at least one contributory factor was recorded against the crash.
An Excel Spreadsheet containing the raw data behind the analysis is available for download here