Driver Impaired by Alcohol – South-East England Case Study
November 21, 2013
MAST Professional Goes Live
December 3, 2013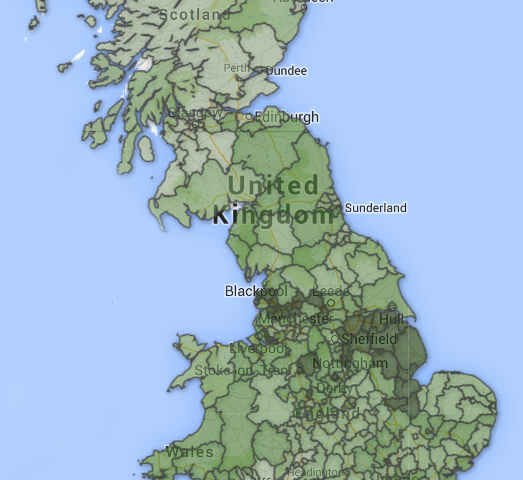
National Signposts 2013
A year on from our review of road safety performance and progress around Great Britain we are now in a position to publish our refinements along with a more in-depth look at the issue of road risk i.e. crashes on local roads per million vehicle miles. We have also moved the time-frame of the analysis forward to include the six years between 2007 and 2012.
It becoming ever clearer that the national comparison data provided by the Department for Transport is unhelpful and potentially misleading when national comparisons are made between different authorities. Measuring risk on roads, rather than to residents, does not allow for objective comparisons with a non-linear relationship between risk and traffic flow. The Signposts Series includes groupings of similar authorities to allow better assessment of risk at a local level.


Summary of Results
Although overall national crash and casualty rates are falling, there are significant local variations in road safety performance. This is particularly important to understand at a time when localism is emerging as the dominant driver of policy and funding in road safety. Local authorities need meaningful measures of comparative performance in order to drive progress. Road Safety Analysis provides this by publishing hundreds of [detailed local profiles]. These are summarised in this national report, which measures levels of risk on local roads and to local residents. Based on performance data for the last six years, risk has been set in context by measuring local progress relative to national performance during the same period.
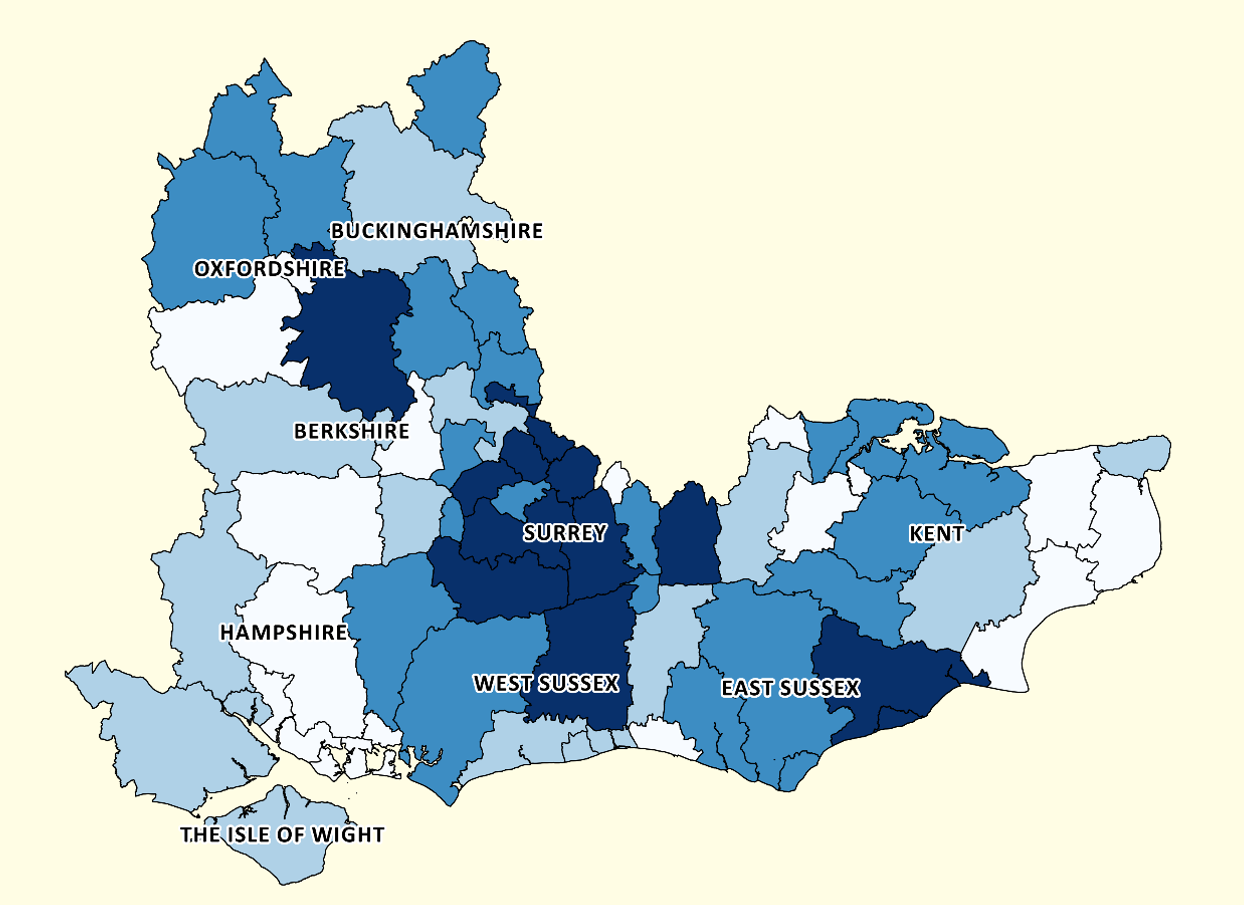
Overall London and the South East exhibit higher risk and are generally making slower progress. Scotland experiences lower levels of risk than elsewhere in Britain and is generally making more progress. Significant progress has been made in North West England and some urban areas outside London, in particular the Midlands and parts of Wales, over the last three years.
Risk to communities compares resident casualty performance to resident population. Many communities in London and Scotland enjoy low risk rates, but certain deprived areas and rural communities also perform well. Higher risk areas are also mixed in nature, although they often include communities with high levels of deprivation. Most progress on resident risk has been seen outside the South East, while urban communities tend to make the slowest progress.
Risk on particular road networks is measured by comparing crash performance to traffic. The best performing authority networks are mostly in more rural areas with little deprivation, particularly in Scotland and Wales. The degree to which risk is showing as being significantly higher on London's roads calls into question the reliability of measuring risk according to traffic flow. This is further explored when similar authorities are grouped and analysed together.
Most progress in reducing road risk has been made in urban areas outside the South East, particularly in Greater Manchester. Progress is noticeably slower in London. London's slow progress compared to other urban areas is not attributable to higher traffic flow.