The Link Between Deprivation and Road Safety
December 8, 2015
GB Drink Drive Trends Revealed
December 16, 2015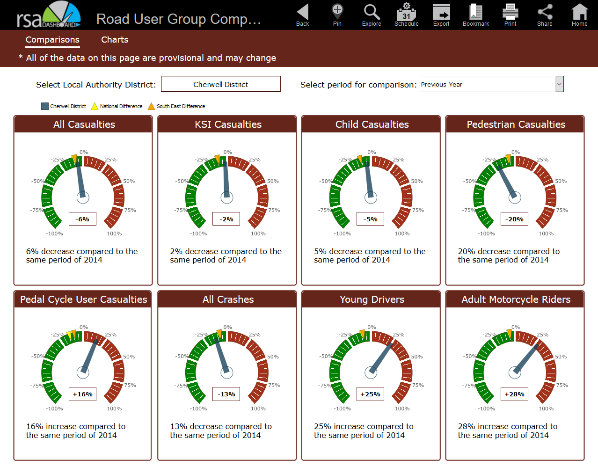
New 'Provisional' Dashboard Launched
Following the release of the first half year STATS19 data in November, Road Safety Analysis have been working on a new dashboard to allow local authorities to visualise this information. The new MAST Provisional dashboard will sit alongside the existing MAST Provisional Online tool and offers a quick insight in to the emerging trends in the first half of the year. The dashboard will be updated following the release of the July to September data to include data from the first three quarters of the year.
The ‘Comparisons’ page shows eight gauges for various road user groups including child casualties, pedal cycle user casualties and young driver collision involvement. It shows the percentage change from the first half of the previous year (2014) to the first half of the current year (2015) for the eight indicators.
Also shown on the gauges is the percentage change nationally and regionally. The local authority district in which the collisions occurred can be changed via the drop down box to the top of the screen as can the comparison period.
The comparison period options are, the same period (the first half of the year in this instance) of the previous year, the average over the first half of the most recent five years (2010-2014) and the average over the first half of the five years previous to this (2005-2009).
Cherwell District has been chosen in the example here. In Cherwell, casualties have reduced slightly compared to the same period of last year and at roughly the same level as Britain and the South East as a whole. Pedestrian casualties have reduced quite significantly but there have been increases in pedal cycle user casualty numbers, young driver collision involvement and adult motorcycle collision involvement.

Changing the comparison period to ‘Previous 5 Year Average (2010-2014)’ shows a more significant increase in motorcycle rider collision involvement and pedal cycle user casualties but not so much of an increase in young driver involvement.

Looking at the comparison to the baseline period, pedal cycle user casualties have significantly increased as have adult motorcycle riders. There have been some slight reductions in other road user group casualties but these reductions are less than they are nationally and regionally.
Clicking on the ‘Charts’ label at the top of the page brings up the charts page. Initially, all available data is shown so all of 2004 to 2014 and the first six months of 2015, however, this can be changed using the ‘quarters’ drop down box to the top right. This is useful if you only want to see the trends for the first two quarters of the year
.MAST Provisional Dashboard enables users to quickly gain insight in to the short term and long term trends on an authorities roads and how this compares to the national and regional trends. MAST Provisional Online can be used for more detailed analysis of any trends identified in the dashboard.

The screenshot (left) shows trends for nine road user groups, the same eight as on the comparisons page but with the addition of senior (aged 65+) drivers involved in injury collisions. Only the first two quarters have been selected and Cherwell District has been retained from the previous page. As we can see the increase in pedal cycle user casualties and motorcycle riders from the previous page is reflected in the charts. We can also see that the number of motorcycle riders is fairly low and that a large reduction in the first half of 2012 has resulted in the gauge on the previous page showing a high percentage increase compared to the previous 5 year average. The charts on this page provide some context to the percentages on the comparisons page.