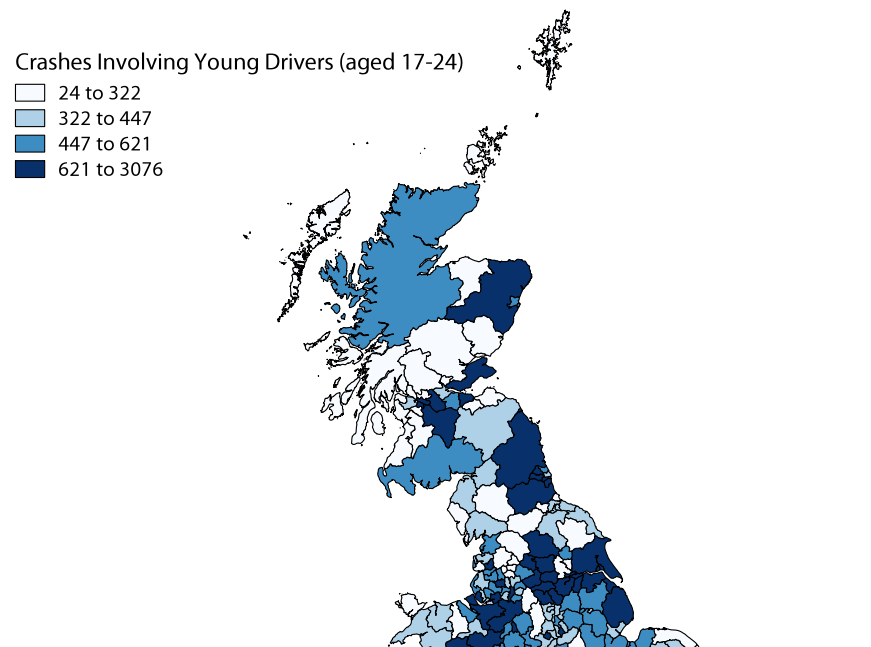
Visualising Road Safety Data with Maps
January 7, 2016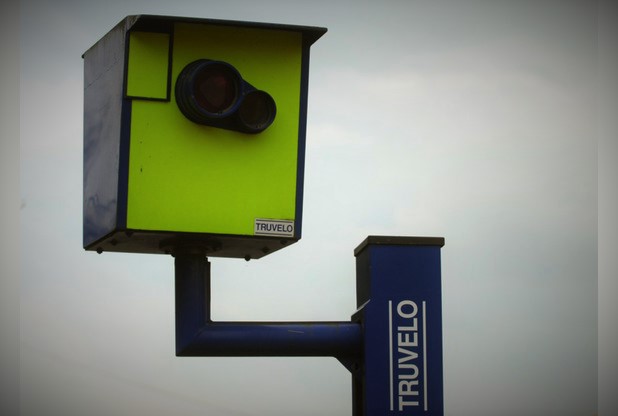
Analysing Northamptonshire’s Switched-Off Speed Cameras
March 10, 2016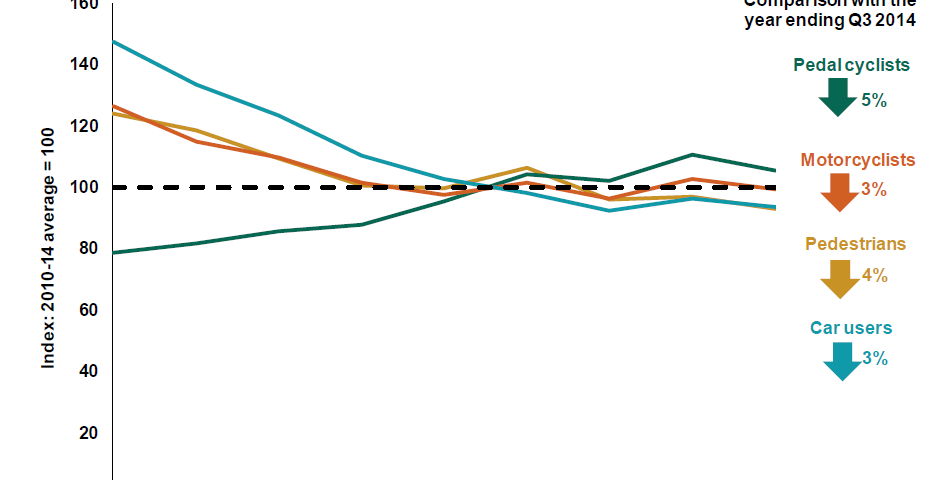

Can we rely on the DfT's in-year provisional estimates?
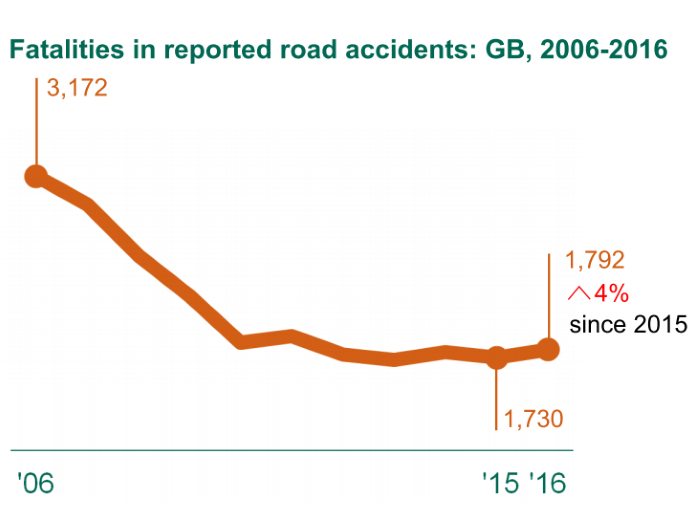
As promised, the DfT have today published their update on reported road casualties in 2015, letting us know what the situation is until the end of September 2015. Lots of road safety groups are interested in these results as it may give them an indication of recent trends. At RSA we have spent over a decade analysing these in-year figures and usually treat them with a large dose of caution. This time, though, there is a lot more information in there about how and why the numbers may have changed, which made interesting reading. First of all though, a word on how useful these numbers can ever be, even if they are 100% correct.

Statistically significant results
Within the road casualties dataset for GB we sadly have a large amount of information that makes robust analysis quite easy. When the full-year results are announced there are hundreds of thousands of casualties and vehicles to work with and comparing change over time can tell us when meaningful changes have taken place. The word ‘meaningful’ can depend on your position but for most analysts we would want to find out if the change is statistically significant, which would hopefully rule out any blips and random fluctuations in the data (technically classified as natural variation).DfT Definition
The 95% confidence level is the standard against which statistics are typically tested. It means that in 100 years with the same risk of fatalities (or injury), 95 of those years will result in a number of fatalities (or injuries) between a given range. If the actual change falls outside of this range then we can be 95% confident that the change is as a result of a genuine trend rather than a product of chance.Example from the 2014 data
When RRCGB was published in September 2015 there was a section on the reported changes in casualty numbers and whether they were statistically significant. You can see the results in the table below which create an expected range (central forecast) against which the results can be tested. In this case the increases in fatalities and KSI casualties as not significant but the increase in casualties of all severities was.
Two ways of looking at in-year data
Looking at the provisional data for July – September 2015, the raw data appears to show some variations versus the previous years. Rather than just looking at three months’ worth of data the DfT have created ‘rolling years’ that effectively change the year end date – in this case to 30th September rather than 31st December. The results for road deaths seem to be bad news with a 3% increase, although this figure is in line with the average for the preceding five years. When reviewing KSI casualties there has been a 3% drop, set against a rise in traffic levels of 2.2% which may indicate our roads are becoming relatively safer. Using the DfT’s significance tests they say that, ‘There has been a statistically significant decrease in the number of people injured (but not killed) in road traffic accidents between the years ending September 2014 and 2015’, but that ‘Although the number of people killed in road traffic accidents has increased between years, this change is small enough that it can be explained by the natural variation in deaths over time’. They have also published figures for the third quarter on their own, none of which pass the 95% confidence level, despite showing similar percentage change reductions for KSI casualties. This demonstrates why you need more data to have confidence that the changes you are seeing are significant. Local authorities and police forces often take an interest in in-year data and hope to reveal patterns to help understand what’s happening on the roads. Given the small numbers involved here it will be a very difficult job to truly say whether local changes are significant or not. Filtering data to individual user groups is almost meaningless on a quarter-by-quarter basis.Road User Types
The DfT have also reviewed road user types (car users, pedestrians, pedal cyclists and motorcyclists) using the rolling-year methodology but have not carried out significance tests, probably because they wouldn’t stand a chance of returning a significant. Here KSI casualties in all groups have fallen with pedal cyclist casualties dropping most (5%) in the year ending 30th September 2015. Child casualties have fallen significantly if you compare tends against the 2010-14 average with a 16% reduction in KSI casualties. You can of course review the individual quarter’s performance but the numbers get smaller, percentage changes get higher, and there’s no hope of calculating significance.Pedal Cycle Casualties -5%
Motorbike Casualties -4%
Why have casualties reduced?
Whenever changes in casualty number are reported the natural question to ask is ‘why’ and this is difficult to answer. Road traffic is held up as the biggest influencing factor as exposure would surely help to determine the number of those injured on the roads. This is in turn linked to economic performance which could actually be what influences traffic levels in the first place. Other big factors that come into play are the weather (see our article from last year on this) and changes in licensure patterns (fewer young drivers). The DfT themselves say of the recent changes that, ‘there are a number of factors that have combined together to improve some aspects of safety on Britain’s roads’. The DfT have for the first time applied an adjustment allowing for weather effects which, rather unexcitedly, shows that weather for the year ending September 30th 2015 was remarkably normal with barely any correction up or down. The previous year’s data did receive more of a correction however which virtually wipes out all of the KSI reductions mentioned at the start of this article. This begs the question then; if the KSI reductions are statistically significant, but can largely be attributed to a change to normal weather patterns, does that mean that it’s the weather that has significantly changed and not the safety levels on our roads?