
MAST Portal goes live
June 24, 2016
Motorcyclist Casualties – What’s Going On?
July 21, 2016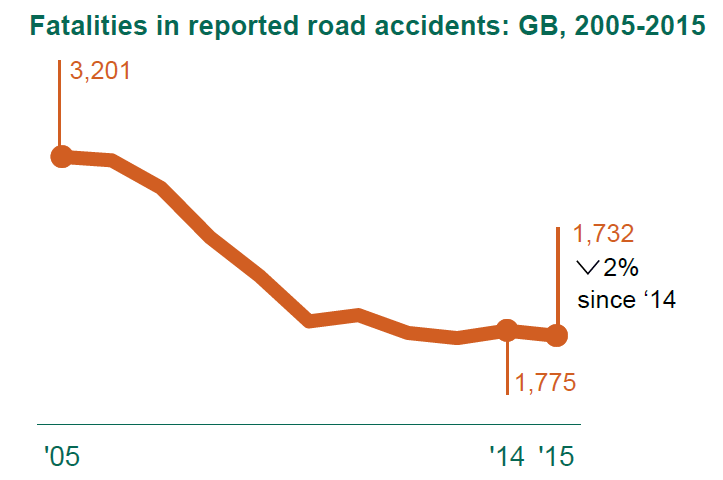
2015 Road Safety Statistics – Evidencing the new ‘epoch’
This morning the Department for Transport (DfT) published the ‘Reported road casualties in Great Britain: main results 2015’ statistical release. This annual event is eagerly awaited by those in the profession, both to review national trends and to see how local statistics compare. The new approach to statistical testing, started last year, does pose questions for local analysts though as there is a clear emphasis on what is a real change in results and what could be described as a ‘blip’ (my phrase, not the DfT’s).
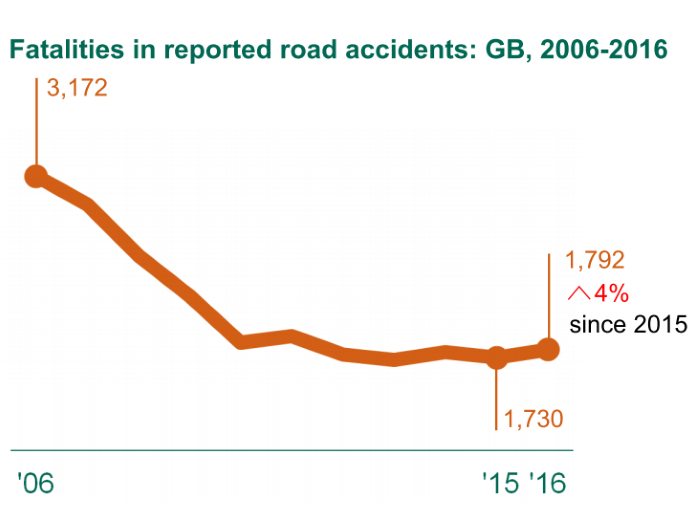
Fatalities down 43 versus 2014
Selecting a period for comparison
In order to identify a change in the 2015 data you need to set your benchmark. Over the past few years the DfT has used the 2005 – 2009 five-year period as a baseline, adopting the period used in the 2011 Strategic Framework for Road Safety. In this year’s report the five-year baseline has shifted to 2010 – 2014. This could be for a number of reasons: • It makes more sense to use the most recent 5 years’ worth of data – something we do with our Area Profile documents that compare results in one area against national and other trends • The Strategic Framework was published under the 2010 to 2015 Conservative and Liberal Democrat coalition government (as stated on the www.gov.uk website) and has been replaced by a road safety statement by the current administration. • The periods 05-09 and 10-14 could be described as belonging to different epochs in road safety with significant reductions in casualties to 2009 followed by a general plateau (basin may be more appropriate) since 2010. Reference is made to longer time periods in the report but the statistical testing is always against the 10-14 trend, or against last year.
Bouncing Back
2014 saw some notable changes in results for some road user groups. Total casualties increased for the first time since 1997, there was a jump in pedestrian deaths of 12% (48 fatalities); an increase in child KSI casualties (5%); and a large rise in those over the age of 60 seriously injured on the roads (11%).
The 2015 results show a return to more typical levels in these categories with pedestrians back down to near-record lows (409 in 2015 compared to a best of 398 in 2013); seriously injured child casualties at a new record low (1,910); and a small drop in seriously injured casualties over the age of 60 (down 2% but back to around the numbers seen in 2012).
These results in areas that people considered a ‘concern’ last year perhaps illustrates the problem of using single year results to evidence an emerging problem – even at a national level with large sample sizes. The DfT do use a ‘this year versus last year comparison’ and carry out statistical testing on these figures, as well as against the long-term trend. The results shown below indicate that for the year-on-year results the decreases for serious, slight and all casualties are a significant change, but the small drop in fatalities isn’t.
Furthermore, the statistical analysis shows that the 2015 results aren’t any different from what would be expected when compared to the 2010 – 14 baseline.

A period of stability?
The DfT themselves have come to the conclusion that many have thought for a couple of years; we are in a period of relatively little change in road safety performance. They state, 'The evidence, points towards Britain being in a period when the fatality numbers are fairly stable and most of the changes relate random variation '. They follow up later in the report saying, ‘there is no net change in road safety specifically relating to road deaths in Britain at the moment.’
So is this the whole story or is something else going in in the statistics that can identify changes in road safety performance? Well, car occupant casualties has fallen when 2015 is compared to the longer-term trend. Fatalities are down 8% as are slightly injured casualties. This is against a background of a 3% increase in traffic so absolute and relative safety levels are improving.
This is not the case for vulnerable road users. Pedestrians haven’t done as well with only a 4% drop in fatalities and motorcyclists deaths have increased by 4% compared to the 10-14 average. Figures for cyclists are mixed with a large drop in deaths, but they form a relatively small sample size compared to the other two groups.
So within this period of stability we are actually seeing improvements for the most common type of casualty, car occupants, but others are improving at a slower rate or are increasing.

How to compare your results
Many authorities, be they police forces or highway authorities, will have already published results for their areas so how can you tell if your results are significant? Well, the first this you should definitely not do is look at this year versus last year.
Changes over a one-year period in anywhere other than a very large area are unlikely to be statistically significant and even if you carry out the best approach (using a five-year baseline) small single-digit percentage changes may still only constitute a ‘blip’.
Changing populations and traffic levels at a local level should be taken into account where possible. Calculating rates and comparing these to a national, or regional figure is much better and is an approach we have used in the PACTS Constituency Dashboard.
Understanding the relative risk in your road user categories is a much better indication of performance and helps target problem areas.

A new approach
It has become clear over the last few stats releases that the DfT are taking a new approach to reviewing road safety performance. They are focussing on measuring changes for significance and taking into account external factors such as changes in traffic, population levels, and the weather.
The new approach is to be commended, as is the improvement in the presentation of results and focus on vulnerable road users. The DfT have not shied away from highlighting negative results in this release or previous ones and have followed up with new analyses where possible.
They are also keen to expose shortcomings in the data with regular reference to under-reporting and changes in reporting methods. It was interesting to note that the roll-out of CRASH may lead to an increase in the classification of ‘serious’ injuries:
‘There is some evidence that casualty records coming from CRASH have had a 2 percentage point swing from slight injuries to serious injuries. Given the very small amount of CRASH-derived data for 2015 this is unlikely to have had much effect on the figures published here. We will provide more detail and analysis in the 2016 statistics’
The full data release will come at the end of September with the opportunity to see more detailed analyses that could potentially throw more light on the current situation. Our MAST Portal will be updated with the 2015 data over the coming months too with the different versions of MAST, plus dashboards and maps refreshed by the time the full RRCGB 2015 comes out.