
USER GROUP DASHBOARDS 
MAST Online has always allowed user to analyse aggregated data quickly and easily, and its sister tool CrashMap has allowed user to reveal more information about collision locations. We are now able to provide a joint platform that combines both approaches in a single tool which focuses on issues relating to specific road user groups.
The six themed dashboards for child casualties, young drivers, older drivers, motorcyclists, pedestrians and cyclists, have full filtering and selection tools covering a wide range of collision attributes.
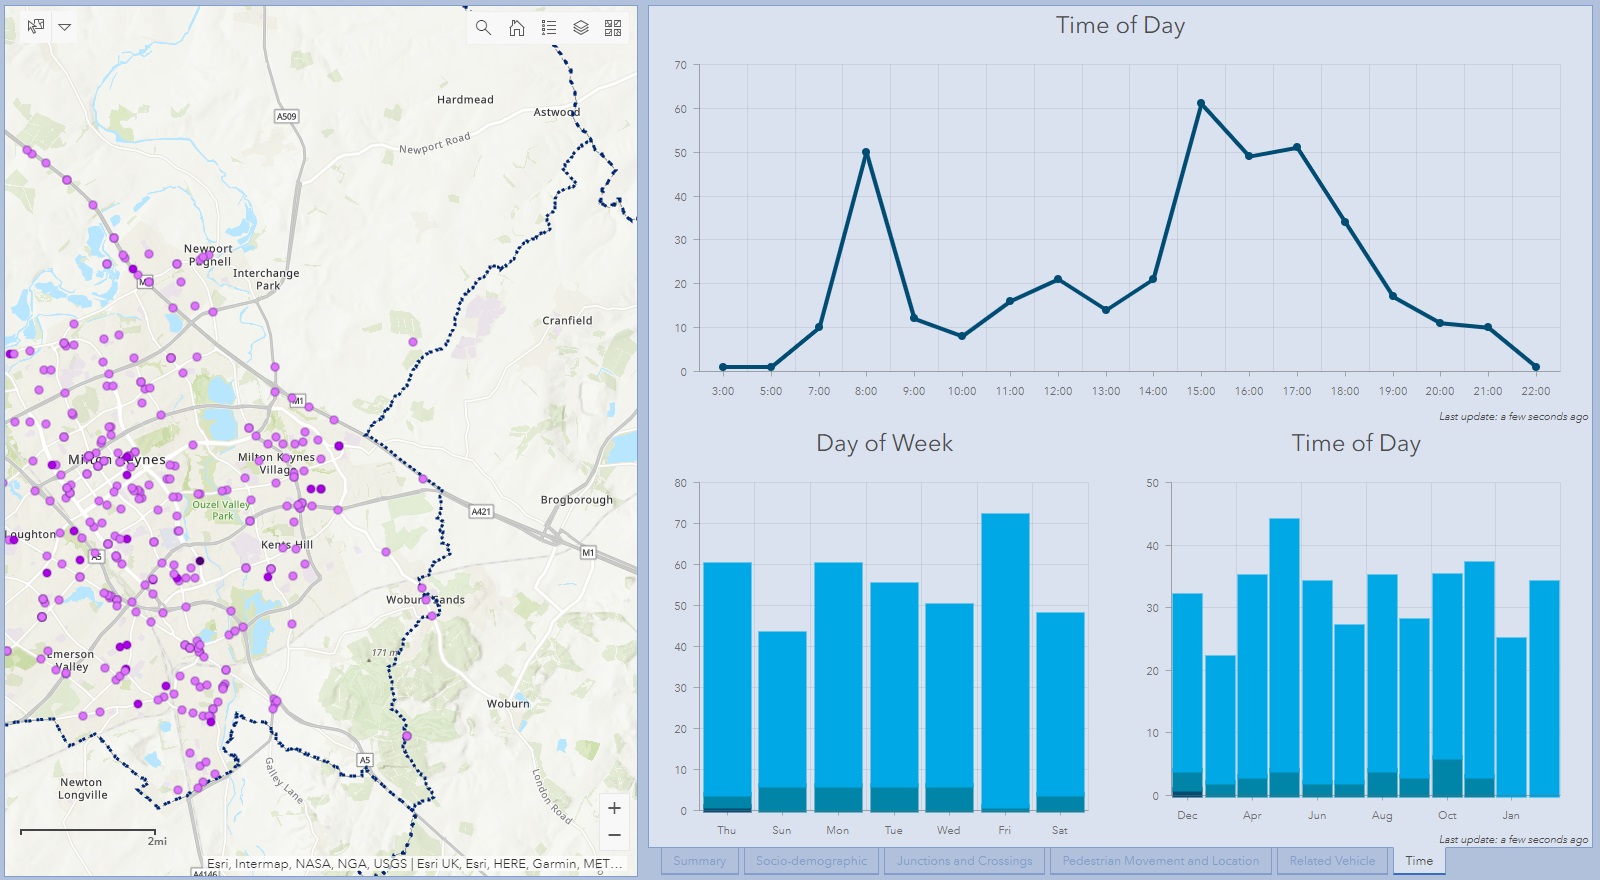
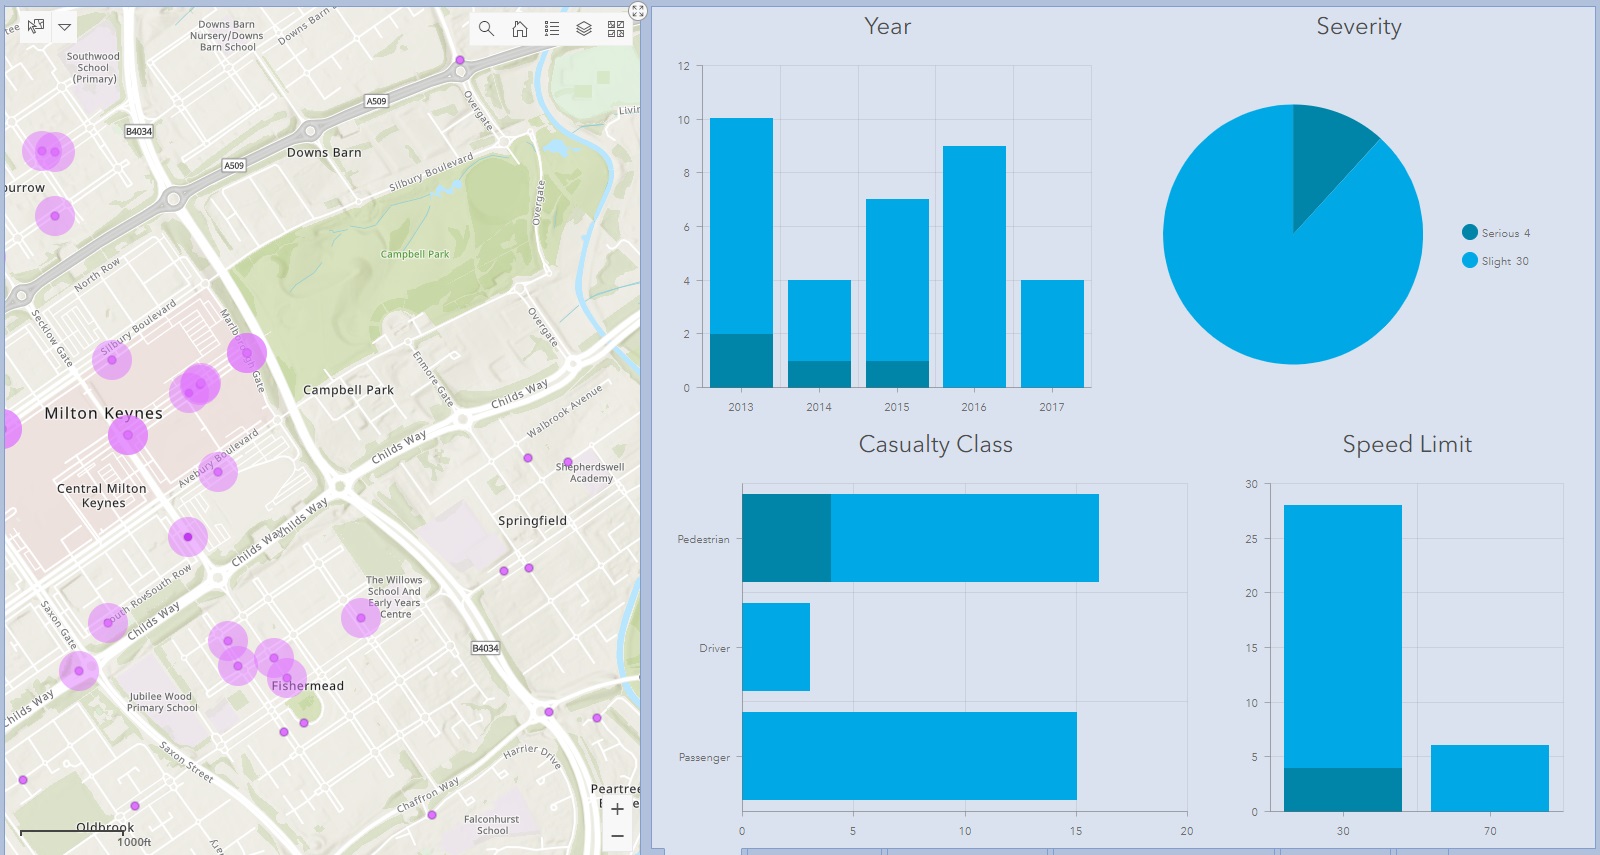
By selecting items on individual charts you can filter all other values both in the associated charts and graphs but also the collisions on the map.
The reverse is also true with several selection tools available to allow junction, routes or areas to be selected and the charts will then be adjusted accordingly.
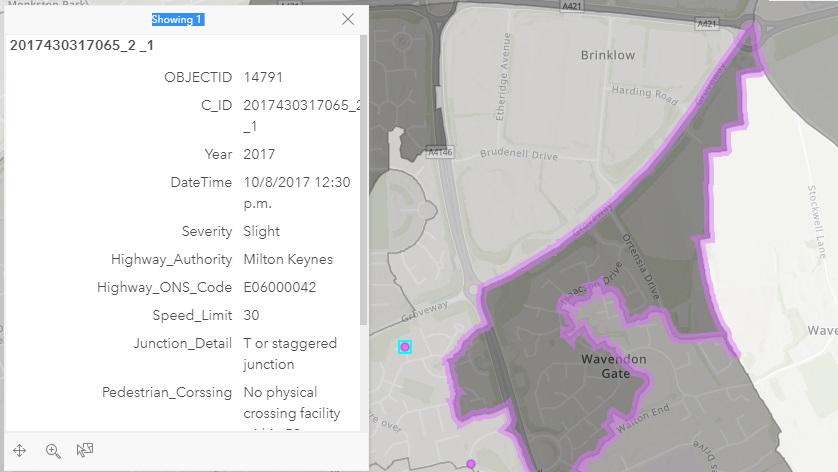
Included within the map are the resident risk rate calculations for the associated road user groups which also appear in the Headliner reports. Users can then select the highest-risk areas to discover very quickly and in some detail the corresponding collision and casualty features.
Access to the full data with Mosaic profiles and home area is currently restricted to certain categories of MAST user (please contact us for further details).
Six themed dashboards for:
Your dashboard enables you to filter data by:
PRICING
- Our sister company Agilysis is an Esri Partner allowing access to powerful online maps and dashboards
- This tool provides a series of highly-interactive road casualty dashboards
- These allow the application of multiple filters, together with maps, showing the corresponding collision location
- Users can choose to examine collisions at specific locations, or even select by home area of the driver or casualty