New MAST Mapping dataset unveiled
October 30, 2012
Progressivity
November 16, 2012Official Figures Mask True Road Risk
A new series of reports highlights that the way official figures are presented disguises how recent road safety performance differs significantly across the country.

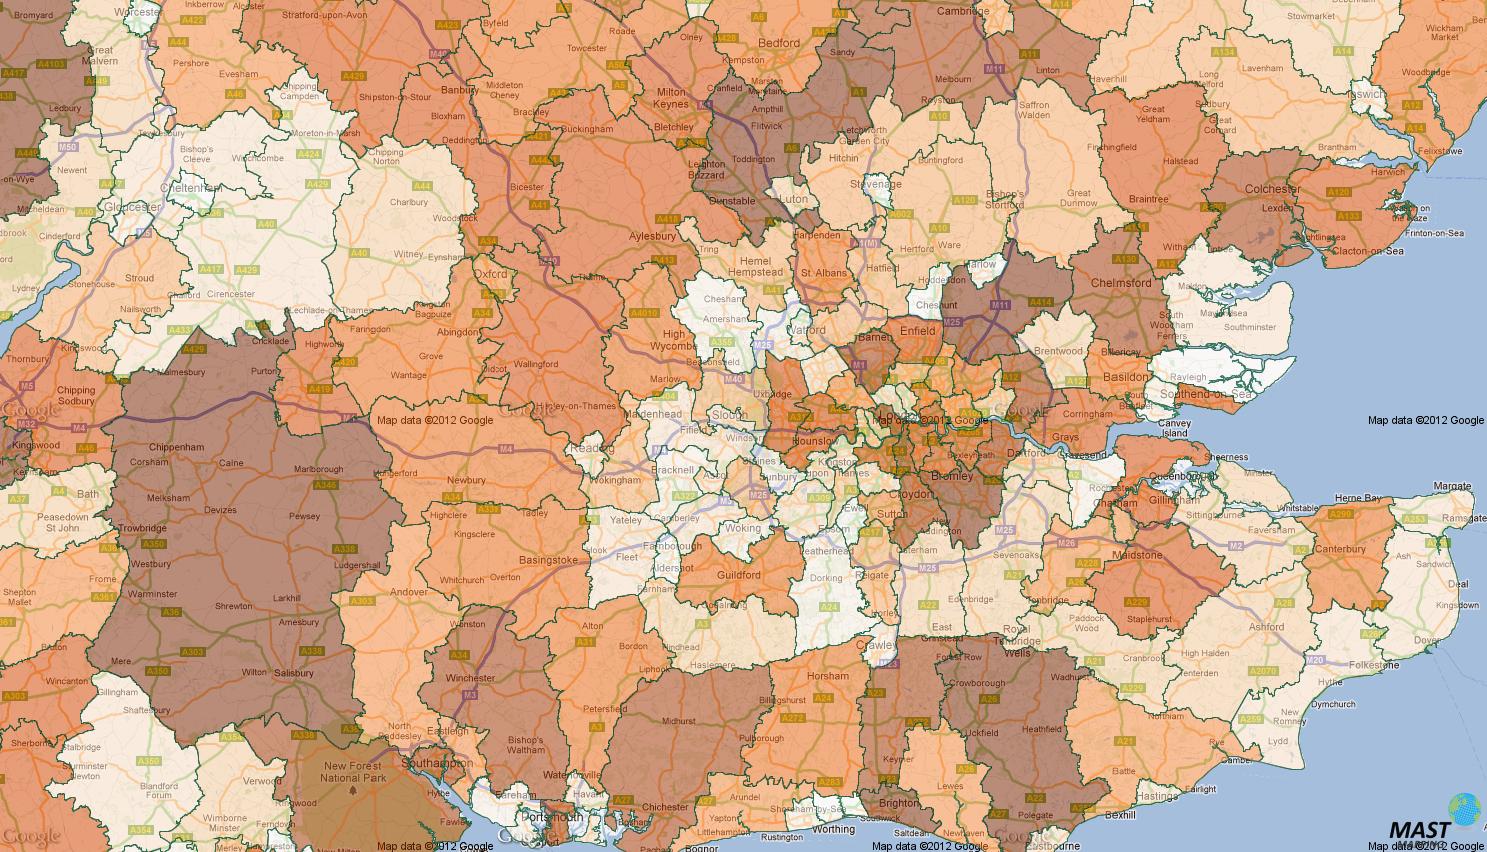
Most notably, when you examine recent progress made in reducing risk to the resident population, 14 London Boroughs feature in a list of the 20 poorest performing local authority districts in the country when compared to the national average. Conversely, the districts that are witnessing the best improvement nationwide are spread across Scotland, Wales, the North West and the Midlands. A similar picture can also be seen when progress on reducing the number of traffic crashes relative to traffic flow is examined; in this case 15 out of the 20 worst performing areas are London boroughs.
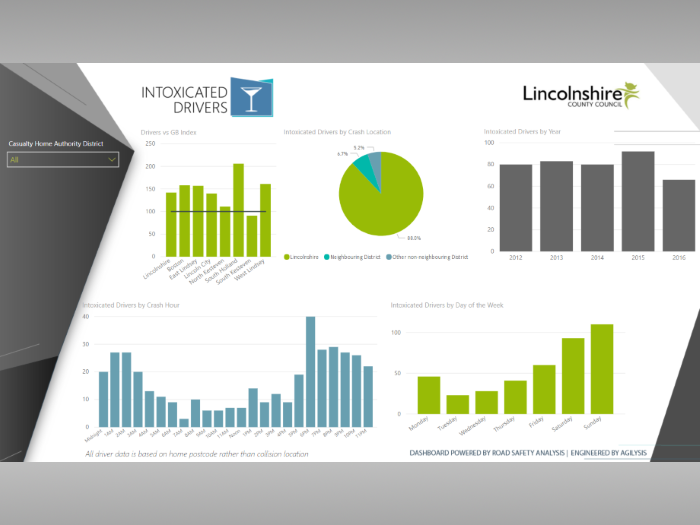
To assist those interested in seeing where a particular area of the country is performing, Road Safety Analysis has also published a set of interactive charts showing comparative performance by local authority on their website [www.roadsafetyanalysis.org]
Richard Owen, a Director of Road Safety Analysis and co-author of the report said,
“At a time when the Department for Transport is relying on public pressure or local politics to be the driving force for improvement in Road Safety, it is remarkable that almost 90 percent of those injured on the roads are ignored in the official local performance figures. Furthermore, the primary measure used by the DfT to assess risk rates does not appear to allow true, meaningful comparisons to be made on a nationwide basis.”
He continued, “In order to avoid this pitfall, road safety professionals, service managers and council members (both in office and opposition) need to make reliable judgements on local performance. Therefore, high quality comparative performance data is the key requirement for policy makers and practitioners if they are to place local priorities in context.”
The report is published on the same day the DfT releases its latest road safety progress figures for 2012, and less than a week after the Chair of the Transport Select Committee, published her comments on the government’s response to its recent report into Road Safety. In her comments Louise Ellman MP said,
“Generalised talk about everyone playing their part to bring road casualties down should not be allowed to hide central government’s responsibilities to keep local authorities, the police, other agencies and the public fully focused on delivering significant and sustained improvements in road safety”
A full copy of the report and the interactive charts are available for download from: [https://www.roadsafetyanalysis.org/researc/national-signposts-2012/]
This national report is complemented by a suite of no less than five hundred and eighty-four local reports, which provide detailed analysis into the risks experienced on the roads in every highway authority area and by the residents of every local authority district. Samples can be seen here: [http://www.roadsafetyanalysis.co.uk/services/signpost-series/]


