AXA Local Road Safety Index – Update
December 12, 2014
Spring Conference Roundup
March 25, 2015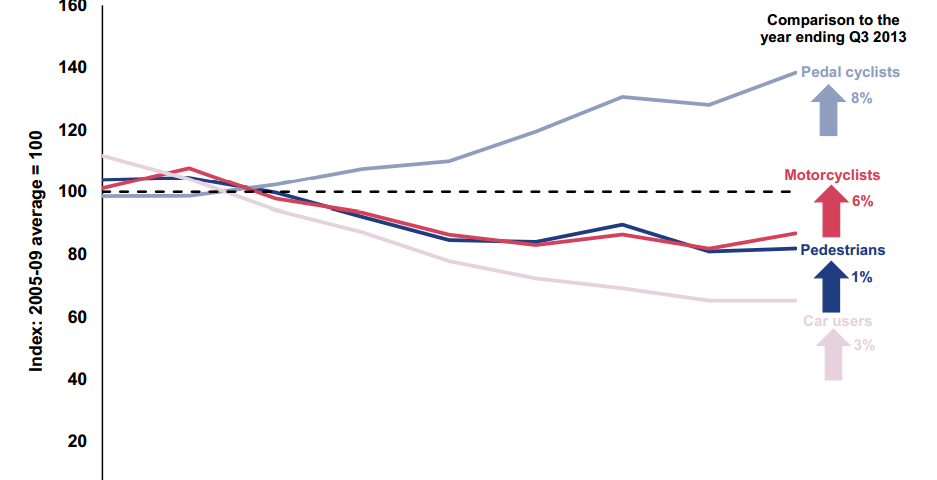
Latest Road Casualty Figures Continue to Disappoint
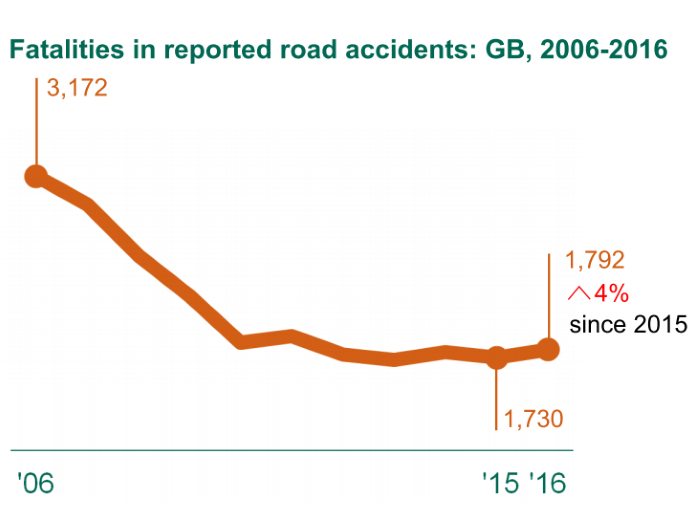
Today sees the release of quarterly provisional estimates for up to the end of quarter 3 of 2014, bringing with it the news of increases in casualties on Great Britain’s roads.
The headline figures are that there has been a 1% increase in road deaths and a 4% increase in killed or serious (KSI) casualties in the year ending September 2014, compared to the previous year. Motor vehicle traffic also increased by 2% over the same time period.
The Department for Transport’s report detailing quarter 3 statistics explains that “part of the reason for these increases over the rolling years is the unusually low number of casualties in the first quarter of 2013. This resulted in a large increase in casualties between Q1 2013 and Q1 2014 with offsetting falls in other quarters.” However, as we explored in our blog last September, there has been a flat-lining in casualty trends since 2010 and no single explanation (weather, recessional pressures, changes in traffic levels, unusually low casualties in one quarter) seems to be able to account for the new trend.
<

Whilst other road users have seen increases in KSI casualties in the year ending September 2014 compared to the previous year, comparisons with the 2005-2009 average show overall reductions. However, the chart does show that for both pedestrians and motorcyclists, the largest gains in reductions were experienced before 2010. Only car occupant casualties have reduced at a gradual consistent rate.
It is also concerning to see the first rise in rolling year comparisons for child KSI casualties since the year ending March 1995. There was a 3% increase in the number of under 16 year olds being killed or seriously injured on Britain’s roads in the year ending September 2014, compared to the previous year.