New ‘Provisional’ Dashboard Launched
December 11, 2015
National Analysts Conference
January 1, 2016

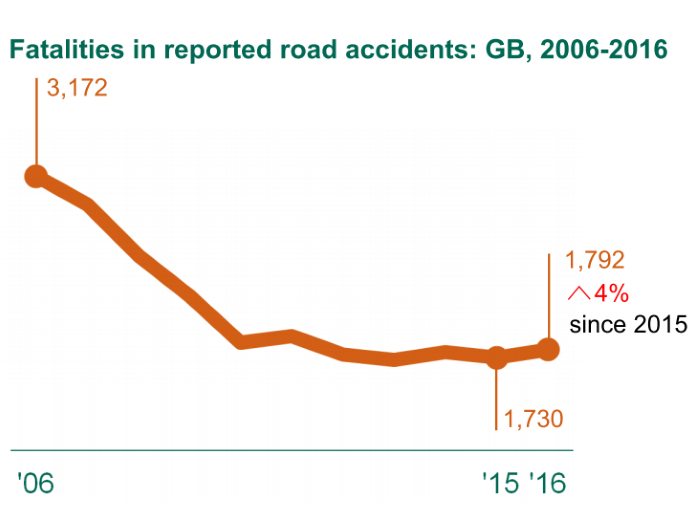
GB Drink Drive Trends Revealed
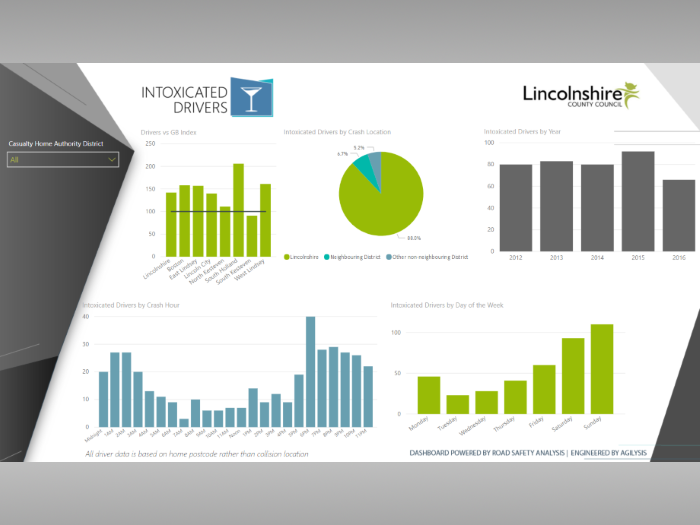
To support the national ‘drink drive’ campaign that is currently being run by the Department for Transport and police forces, Road Safety Analysis have undertaken a unique analysis of car drivers who were ‘under the influence of alcohol’ at the time of a crash. The trends show clear regional differences and highlights the problem of drink driving in rural areas.
The analysis of over half a million car drivers involved in police attended injury collisions between 2010 and 2014 reveals that 2.7% of drivers were considered drunk at the time of the crash. Car drivers who live in rural areas were 22% more likely to be impaired by alcohol than car drivers in general, highlighting the problem of drinking and driving in our countryside.The figures were further broken down by police force area which showed that relative to population size, drivers from Lincolnshire were 71% more likely to be considered over the limit than the national norm.
Car drivers from London were the least likely with a risk rate 63% lower than the average. Nationally the percentage of crash involved car drivers who were intoxicated by alcohol has been declining from 3.1% in 2010 to 2.5% in 2014.
Despite the concentration of effort in December however, it is May that sees the greatest percentage of drunk drivers.
Lincolnshire
London
[iframe src=”https://www.google.com/fusiontables/embedviz?q=select+col6+from+152AcBoGVd0XVA-VV92nCPfHGE-5-ie9J2woDEs1L&viz=MAP&h=false&lat=54.88586020606347&lng=-2.930734300781296&t=1&z=5&l=col6&y=2&tmplt=2&hml=KML”]
For more information about the analysis and the full breakdown please download the press release