GB Road Casualties Main Results 2016 delayed
June 19, 2017
Long Awaited 2016 MAST Update Released
October 6, 2017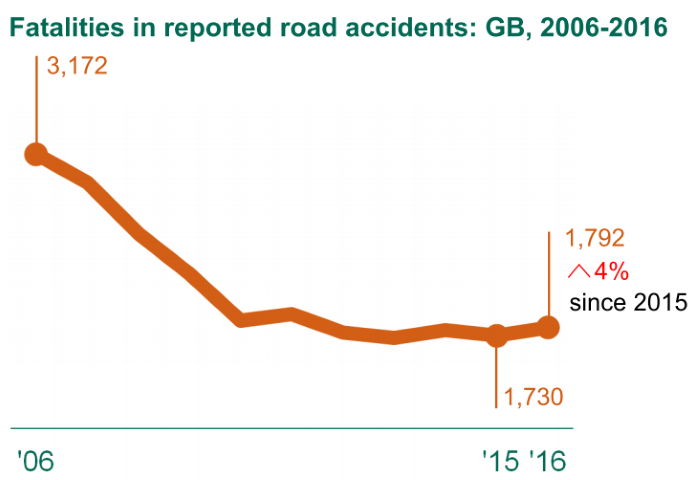
DfT Releases 2016 GB Collision and Casualty Statistics
The long-awaited 2016 collision and casualty figures for Great Britain are finally in, three months after they were supposed to be published. The reason for the delay was acknowledged in July, namely that a new reporting system implemented by the Metropolitan Police late last year (COPA) has caused a large delay in Transport for London being able to provide November and December data to the DfT. Indeed, the data only reached the DfT on the 7th September so to produce today’s report is a monumental feat by the stats team.

Turning to the results that have been published so far (the report is only 28 pages long so the full results must still be being processed), and another problem has arisen, namely reporting inconsistencies in casualties classified as ‘seriously injured’. The new CRASH and COPA systems require police officers to record the types of injuries sustained and a severity is calculated by the system, rather than the officer. The immediate result has been an increase in those classified as seriously injured, something discussed at the Joining the Dots conference back in March so this isn’t a surprise to those of us who work closely with the dataset. Through our work with various authorities we are aware of a rise in serious casualties of around 20%, although it remains to be seen if this is a long-term trend, or a ‘blip’ that only occurs immediately following the new system’s introduction.
In late 2015 and 2016 around half of all police forces switched over to one of the two new systems which is likely to have caused almost all of the 8% jump in serious injuries between 2015 and 2016. The DfT have issued the statement that the data for serious injuries is therefore not comparable and we can only rely on either fatalities or all casualties and collisions. Fatality data analysis works at a national level but not locally where the numbers are too small to be statistically significant. The DfT have continued to provide statistical significance tests on the results which show that even though there was a 4% rise in fatalities, this is not a large enough of a jump to be meaningful. There was, however, a significant drop in all casualties but it would be worth waiting to see how reporting trends pan out in the coming years before jumping to any conclusions.
One significant issue that all of us are going to have to deal with is the fact that our national, and in many case local, KSI figures are now meaningless for 2016. With many authorities such as Highways England and Transport for London adopting KSI targets, what are the next steps? Well, using the ‘all casualties’ data is one option but ultimately a set of correction factors will need to be applied. The DfT will almost certainly have to do this for 2016 and 2017 (when the rest of the forces should switch to CRASH), but how can individual forces and highway authorities do this on their own data? We have some ideas of how this can be done and will be talking to fellow analysts, and the DfT stats team about how this can be expedited to bring confidence in KSI analysis.
It's not all doom-and-gloom though, remember, the change in injury classification systems means we are now starting to get better information – something that has been a worry for some time. Comparing STATS19 against hospital statistics has always shown under-reporting by the police
We have always used all casualty data in our reports and whilst we have split out KSIs, we feel that these often bias against rural authority areas as it’s the higher-speed single carriageways that feature a greater proportion of KSI casualties. Urban authorities which have a lower KSI-to-slight ratio will be able to use all casualty data to monitor performance and trends within individual road user groups with some confidence.


Heading back to the 2016 results there seems to be little change in the individual user groups regularly monitored by the DfT. It is interesting to note an increase in car occupant fatalities which have been decreasing for many years now. Pedestrian fatalities are up but motorcycle casualties are down. A casual observer reviewing the charts will see clearly that there is no significant trend amongst any of the casualty groups, however, and we are only really seeing small fluctuations against a flat-lining trend. Many of those in the road safety community would see this as an outcome of austerity; with reducing number of roads police officers and shrinking local authority budgets, less work is being carried out which could be influencing the figures. It’s impossible to draw this conclusion using any available evidence and results from Europe, where there seems to be a similar flatlining, is perhaps indicating that this is part of a bigger, supra-national trend. It is definitely something worthy of further consideration and beyond the scope of this rather short blog.
The delay in producing the figures has of course impacted our ability to update MAST and associated dashboards / maps (including www.crashmap.co.uk). We have been preparing for this however and Bruce is ready to go with a plan to produce the first update within a fortnight, half the time it normally takes to update MAST. We will take a little longer to update all of the MAST instances and dashboards but we will keep everyone updated via our newsletter. Whether this becomes a regular event is uncertain. The DfT are concerned that we may have to wait a long time for confirmed annual data next year as well. We will be published provisional data for Q1 and Q2 in later October once it’s release by the DfT. It may be that this provisional data becomes more important in future year for those wanting to review more recent trends.