Are Casualties Rising Where Street-Lights are Turned Off?
April 23, 2014
MAST Dashboard Announced
September 22, 2014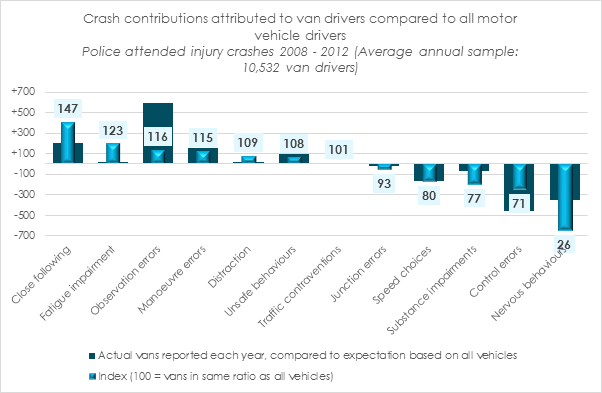
New Insight into Van Driver Crashes
Road Safety Analysis have partnered with AXA Business Insurance to explore the trends surrounding van driver collisions in Great Britain, with the findings published in a report today.
MAST Online was used to analyse 1.34 million motor vehicle drivers involved in injury collisions between 2008 and 2012, with just over 65,000 crashes involving van drivers.

Key messages from AXA Business Insurance:
- It’s time to take van driving seriously. Van drivers are an ever-growing presence on our roads and vital to our economic recovery. This study shows that van crashes often follow very different patterns from other vehicle crashes.
- Van drivers are crashing more due to tiredness and tailgating. Some situations are also far more dangerous in a van too – reversing, motorway driving, parking up and changing lanes most of all
- Good news for van drivers – they crash less through speed; they negotiate cities, roundabouts, traffic jams and built-up environments better.
- We see driver training as essential as well as getting better information to employers/drivers on the especial dangers of these vehicles: longer stopping distances, effects of loads on vehicle response, visibility issues.
Analysis Summary
Van drivers are more likely to be in their early 40’s than any other age group, although the differences are quite slight, other than for very young drivers under the age of 25 and those aged 60 or over where numbers are low. Within the 25 to 54 age range we see that van drivers are crash-involved between 14 and 24% more than expected based on trends seen for all drivers of other vehicles. This is likely to reflect increased exposure on the road as they drive much greater distances than other drivers. Van drivers are more likely to come from lower-income households, with higher crash rates than those seen for drivers of other vehicles from similar backgrounds.
Van drivers are more likely to crash on Primary roads (motorways and dual carriageways) than expected, and much less likely to be crash-involved on urban roads of all type. On all types of roads van drivers are likely to be much further away from home (5 miles as the crow flies) than drivers of other vehicles which heavily reflects their driving patterns. We can see that van drivers are less likely to be involved in crashes at junctions (except slip roads) than other drivers, especially roundabouts.
As well as looking at the total number of crashes involving van drivers by region, we can also reflect on the over-representation based on other vehicles. This shows that in London, vans are crash-involved at a rate 22% higher than other vehicles, with the North East (18%) and West Midlands (13%) also showing increased crash rates.
Unsurprisingly we see much greater crash-involvement rates on weekdays, although with a noticeable different trend on Fridays which is lower than Monday to Thursday. Van drivers are 14% more likely than drivers of other vehicles to be involved in a crash in the first four days of the working week. Monthly trends show little if any difference to all other drivers although hourly rates are significantly changed. Mornings (6am – 12 noon) show crash-involvement rates over a third higher than other vehicles.
Astonishing figures are reported for vehicle manoeuvres where vans are almost one and a half times more likely to be involved in a crash while reversing compared to all other vehicles. Contribution to collisions can also be analysed with different factors groups and reviewed separately compared to the trend for all other vehicles. This shows increased levels of close following, fatigue impairment, observation and manoeuvre errors. On the positive side van drivers are less likely to be reported as contributing to a crash by speeding, or drink and drug impairment.
Read the full report here.