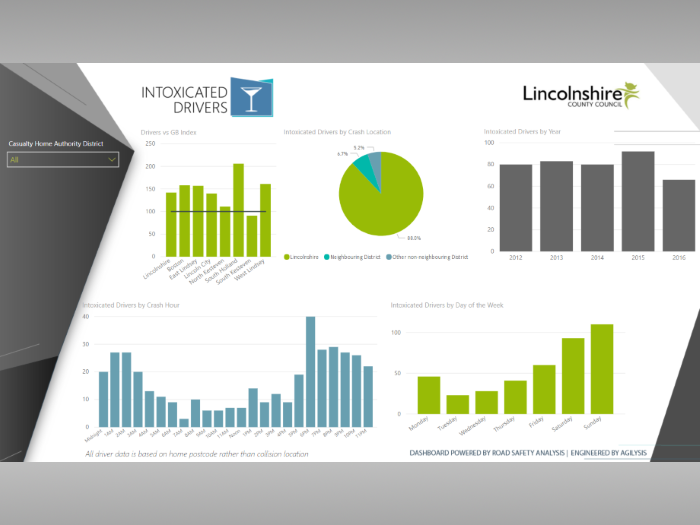
MAST Dashboard Announced
September 22, 2014
Does autumn sun ‘kill 28 drivers per year’?
October 3, 2014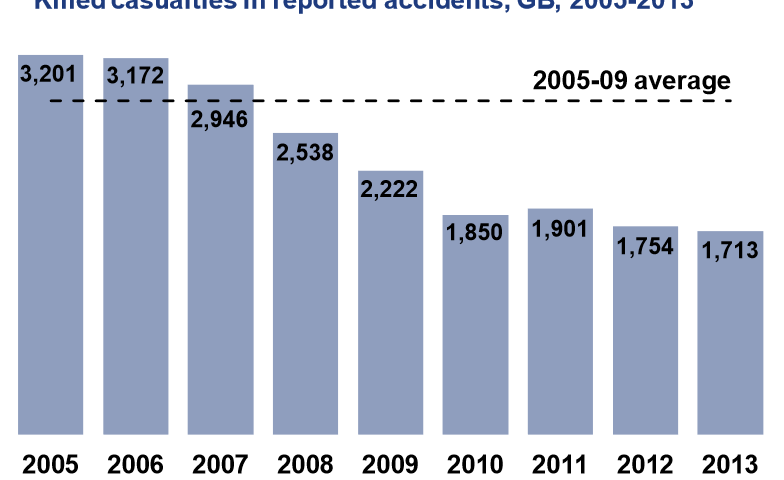
Is this the end of the golden era of casualty reduction?
As ever, the publication of Reported Road Casualties Great Britain, (RRCGB 2013) is an important event in the road safety calendar. For the past few years, casualty reduction appears to have stagnated in Great Britain, with various possible explanations provided. With every passing year where the casualty figures do not return to the general trend, the question must be asked: is this the end of the golden era of casualty reduction in Great Britain?
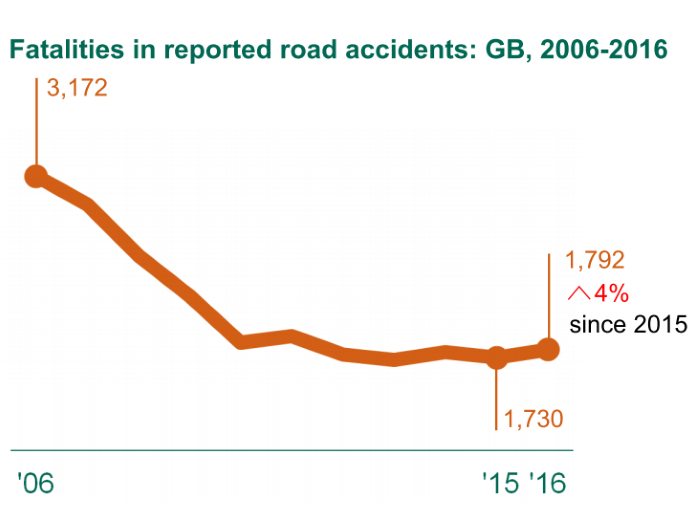
The key findings of RRCGB 2013 include a 2% reduction in road deaths in 2013 compared to 2012, representing the lowest number of deaths since national records began in 1926. “The number of people seriously injured decreased by 6 per cent to 21,657 in 2013, compared to 2012 [and] the total number of casualties in road accidents reported to the police in 2013 was 183,670, down 6 per cent from the 2012 total.”[1] This all sounds like positive news – deaths down to the lowest figure since the early decades of the 20th century and reductions of 6% in serious and all casualties.

However, as can been seen by the chart (left), there has been a definite slowing down in casualty rates in recent years. Compared to the 2005-09 average, there were clear downward trends in serious and slight casualties from 2000 to 2010, when the numbers of casualties have plateaued. With fatal casualties, the trend was less consistent with other periods where numbers of deaths didn’t reduce (2000-2003 and 2004-2006) but there had been a period of clear reductions from 2006 to 2010.

The rates have stagnated across road user groups: the following chart shows the four largest casualty groups against per billion miles travelled, indexed against the 2005-09 average. Whilst the largest gains in casualty reduction have been made amongst car occupants (43% compared to 2005-09), reductions have slowed significantly since 2010. For the more vulnerable road users of pedal cyclists motorcyclists and pedestrians, casualty rates per billion miles have not reduced as much as car users since 2005-09 and reductions have also slowed since 2010.
What affects the casualty trends?
RRCGB 2013 examines the various factors which can affect casualty trends in an attempt to shed light on why some periods in time experience greater reductions than others:
“What affects the casualty trends?
- It is very difficult to isolate the impact of a single factor in the casualty trends, but broadly, the long-term decrease is likely to have been driven by a combination of:
- Road safety education and training
- Improved vehicle and highway technology/engineering
- Reduction in speeds (there is evidence that speed limit compliance has improved over the last decade and average free-flow speeds have decreased)
- Improved post-accident care to improve outcomes (e.g. the creation of major trauma centres in England)
- These factors will have both reduced the likelihood of an accident in the first place, as well as reducing the severity and number of casualties when they do occur.
- Shorter term trends can also be driven by economic factors. There is evidence that economic recessions have accelerated decreases in road deaths, although the relationship between GDP and fatalities is neither simple nor linear.
- Another important factor in understanding year-on-year trends is the weather. There is evidence that particularly cold or wet weather can affect both road user exposure and driver behaviours, both of which will affect the number of casualties.”[2]
Weather
RRCGB 2013 includes a separate article entitled ‘Understanding short term casualty trends; the impact of the weather.’ It explains that “as the number of road casualties gets smaller, understanding the reasons behind year-on-year changes becomes more important. Weather patterns provide useful context to explain year-on-year changes in road casualty statistics.”[3]
The article explains the various effects that extreme weather can have on road casualties:
- Extreme winter weather can lead to a reduction in traffic levels
- This, in turn, results in reductions in collisions
- In extreme conditions, such as heavy snow or ice, road users can often not access roads at all
- People may become reluctant to travel in such conditions and only travel when it is essential
- This is particularly true for vulnerable road users where travelling on motorcycles and pedal cycles becomes more dangerous (slippery roads) and less desirable (low temperatures) thus discouraging travel
- Traffic speeds reduce in periods of extreme winter weather, possibly due to poor visibility or that road users are aware that driving at speeds in adverse conditions is dangerous
- Lower speeds will reduce the probability of injury if a collision does occur or will reduce the severity of the casualty[4]

Given that 2010 saw unusual weather, perhaps it is not unexpected that 2011 saw a 3% increase in road deaths when UK rainfall was close to average and it was the second warmest year since Met Office records began in 1910.
The effect of the weather on casualty figures in 2012 and 2013 is less clear. 2012 was the second wettest year since Met Office records began in 1910 and there was an 8% reduction in road deaths in 2012 compared to 2011. Much of the high levels of rainfall in 2012 were during the summer period, which is the traditional peak period for motorcycle and cycle activity and these two road user groups experienced larger reductions in KSI casualties than car users, presumably because the rain deterred motorcyclists and cyclists from using the roads. “It is reasonable to assume that had 2012 been drier there may have been a higher number of casualties and accidents.”[5]
Whilst adverse weather can explain the large casualty reduction seen in 2010 and the smaller reduction in 2012, the ‘normal’ weather patterns for 2011 and 2013 suggest that the previous downward trend of casualties has slowed for some other reason.
Economic recession
RRCGB 2012 examined the link between reductions in road deaths and recessions (1990-92 and 2008-09). Both of these periods experienced strong falls in the number of deaths. “Although they are not always directly linked, there is a relationship between the performance of the economy in Great Britain and level of traffic on the roads, especially for commercial vehicles. Furthermore, there is a relationship (albeit, again, not direct) between volumes of traffic and the number of road traffic accidents.”[6]

Economic recovery has been slow since 2010 and therefore it might be expected that casualty reduction might have continued to be strong. It is not clear how the relationship between the economy and road deaths can explain the slow progress in casualty reduction since 2010.
Reductions in road safety interventions
The list of factors which can affect casualty trends included a combination of road safety interventions and behavioural changes:
- Road safety education and training
- Improved vehicle and highway technology/engineering
- Reduction in speeds (there is evidence that speed limit compliance has improved over the last decade and average free-flow speeds have decreased)
- Improved post-accident care to improve outcomes (e.g. the creation of major trauma centres in England)
Reductions in vehicle speeds over time will also have affected casualty rates. “Since 2003, average free flow speeds for all vehicle types across each road classification have remained broadly stable.”[7]The following chart shows that since 2003, the percentages of motorcycles, cars and LGVs exceeding the speed limit on motorways has reduced. It shows that for cars and motorcycles the greatest reduction in the percentages exceeding the limit were seen between 2005 and 2008 (after the formation of the National Safety Camera Programme) and whilst reductions have continued since 2011, the reductions are lower. Perhaps the reductions in the percentage exceeding the speed limit have slowed because levels of speed enforcement have reduced. Alternatively, it could be that as the percentages of motorists willing to exceed the limit become lower, it becomes harder to change the behaviour of the minority.

It could be that a combination of the biggest gains having already been made (through medical and engineering changes) and that reductions in enforcement and ETP activity are playing a part in the stagnation of casualty reduction.
Drink-drive legislation – tougher limits, tougher enforcement
One area where road safety activity has reduced has been in drink-drive publicity. A Freedom of Information request from March 2014 asked questions about how much the Department for Transport had spent on drink drive campaigns over the previous decade.[8] There was a peak in spend on THINK! drink drive advertising media expenditure of £2,962,763 in the financial year of 2008-09 which was reduced to £363,917 in 2010-11. Data for the financial year 2006-07 was not available.
Between 2006 and 2010, there was a general downward trend in the number of road deaths in drink drive collisions, coinciding with high levels of road safety advertising spend. Since 2010, there has been little change in the number of people killed in drink drive collisions at a time when advertising spend has been substantially lower than in other time periods.[9]
The general standard blood alcohol limit in Europe is 0.5mg per ml (with some countries having a 0.2mg per ml limit) whilst the UK has the highest limit of 0.8mg per ml. A strong message that drink driving will not be tolerated, through increased ETP activity and the implementation of a lower limit, could have a significant effect on the number of road deaths in the UK.

Q1 2014………
It seems that the publication of RRCGB 2013 brings many questions about the position of casualty reduction in Great Britain in recent years and it appears that there are a variety of factors which could be contributing to the flat-lining of rates. It could be that the biggest gains have been made and that from now on, it will become increasingly hard to achieve high levels of casualty reduction. There are external influences such as the weather and the economic situation which play a part. However, there are activities, ranging from increasing levels of enforcement and ETP interventions to changes in legislation (for example, changes to the drink-drive limit and the introduction of [Graduated Driving Licensing], which has the potential to lead to significant reductions in road casualties in Great Britain), which could have a positive effect on numbers of road deaths.
Whilst data for one quarter should not be considered statistically significant and figures are currently provisional, it is concerning to see that the trend of poor casualty reduction appears to be continuing, with increases in the numbers of pedal cyclists and motorcyclists killed or seriously injured (KSI) in the year ending at Quarter 1 of 2014. There has also been little change in pedestrian or car user KSIs.
So, once again: is this the end of the golden era of casualty reduction in Great Britain?

References
[1] Reported Road Casualties Great Britain: 2013: Annual Report, (Department for Transport, London, September 2014), p. 9
[2] ibid., p.24
[3] Reported Road Casualties Great Britain: 2013 Annual Report: Understanding short term casualty trends; the impact of the weather, (Department for Transport, London, September 2014), p. 1
[4] ibid., p. 3
[5] ibid., p. 12
[6] Reported Road Casualties in Great Britain: 2012 Annual Report, (Department for Transport, London, September 2013), p. 4
[7] Free Flow Vehicle Speed Statistics: Great Britain 2013, (Department for Transport, London, June 2014), p.1
[8] https://www.gov.uk/government/uploads/system/uploads/attachment_data/file/291955/drink-drive-costs.pdf
[9] Reported Road Casualties Great Britain: 2013: Annual Report, (Department for Transport, London, September 2014), p. 214